

8 minute read
Image: Song_about_summer at stock.adobe.com
May 16, 2025
A more in-depth instruction in the use of Filters Interactively in Empower while analyzing project cost and schedule data
By Alan Kristynik, PMP
Encore Analytics Empower is a server-based analytical tool that combines earned value, project schedule(s) and other key information to provide immediate productivity for Project Directors, Project/Program Managers, Control Account Managers, Project Controls Manager/Staff and Organizational Compliance personnel with rich, integrated and interactive system for proactive management of complex projects. Empower is specifically designed to quickly locate problem areas, identify trends, display element-of-cost information, graphically display schedule Gantt information, provide immediate insight into data quality issues.
Introduction
This article provides users with detailed guidance on using Interactive Filters for analyzing project cost and schedule data. The interactive filter parameters covered in this first of a three-part series include:
- Data Quality Indicators (DQI) text parameters
- Color parameters
- Trend parameters
Empower Sort Window
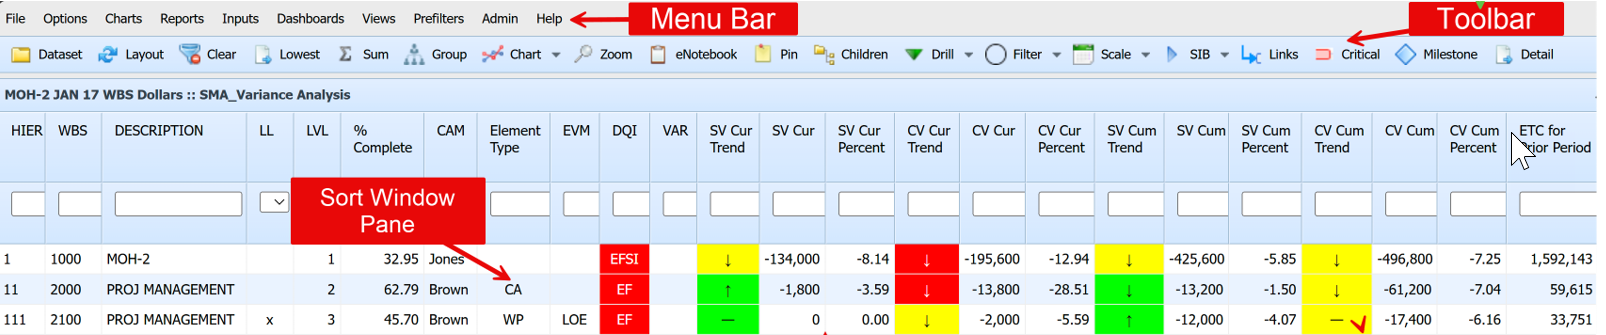
Empower presents information in three primary windows, called the Sort, Chart, and Report Windows. The Sort Window is at the top of the Empower window, with the Chart Window and Report Window side by side and below the Sort Window. For Interactive Filters, our focus is primarily with the Sort Window as seen below:
Interactive Filters
The main advantage of interactive filters in Empower is that they allow for real-time data analysis without having to pre-set filters ahead of time:
- Rules for entering filter criteria in these filter boxes vary, depending on the nature of the data in the given column (i.e., numeric, text, or date field).
- You can enter more than one filter criterion; multiple filter criteria are always joined with a logical AND. Status Bar displays active Filter.
- Use the “Clear” toolbar option to clear interactive
You can quickly specify criteria to view only the rows of data you’re interested in. Key features of Interactive Filters in Empower:
- Filter Bar. Located directly beneath the column headers in the Sort View, this intuitive and accessible tool allows users to easily apply filters to the data displayed in the Sort Window:

- Conditions Data by Rows. Interactive filters let users narrow down data by applying specific conditions to rows, aiding focused analysis. This is useful for refining results based on criteria like data quality indicators, variance trends, dates, or other parameters supported in Empower.
- On-the-Fly Filtering. Interactive Filtering lets you create filters quickly by entering criteria in the Filter Bar beneath column headers. For example, inputting a value range instantly shows only matching data, making analysis easier.
- Instant Application of Filters. Upon entering filter criteria into the data column, the Sort Window is promptly updated to reflect only those rows that satisfy the specified conditions. This immediate feedback enables users to streamline their datasets efficiently, thus reducing delays and enhancing the accuracy of their analysis.

Interactive Filter Parameters
The following are the parameters supported by Empower for filtering data interactively:
Data Quality Indicators (DQI) Text Fields
The Data Quality Indicator (DQI) field in Empower is a powerful analysis tool that flags accounts failing data quality checks. These checks fall into five categories, each identified by a specific letter code used by Empower.
| Input | Result Description |
|---|---|
| E | Earned Value Anomalies |
| S | Schedule Anomalies |
| F | Forecast/EAC Reasonableness Anomalies |
| I | Cost/Schedule Integration Anomalies |
| V | Variance At Completion Anomalies |
The DQI column in the Sort Window shows code letters (E, S, F, I, V) for different data quality issues. To filter by DQI, enter one or more of these letters in any order. Elements with matching letters will be displayed.
- Enter one or more uppercase code letters (e.g., “ES”). Empower returns any element whose DQI field contains at least one of those letters. For example, filtering on “ES” will match DQI values like “E”, “S”, “ES”, “EFS”, etc.
- Note: Filtering is case-sensitive — “E” ≠ “e”.
By default, multiple letters are combined using logical AND operations. To use logical OR operations, insert a vertical bar (‘|’). For example:
| Syntax | Meaning |
|---|---|
| ES | AND Logic: Returns rows containing both E and S |
| (space) | Returns rows where DQI field is blank |
| _ | Returns rows where DQI field is not blank |
| !F | Negation: Returns rows not containing the letter F |
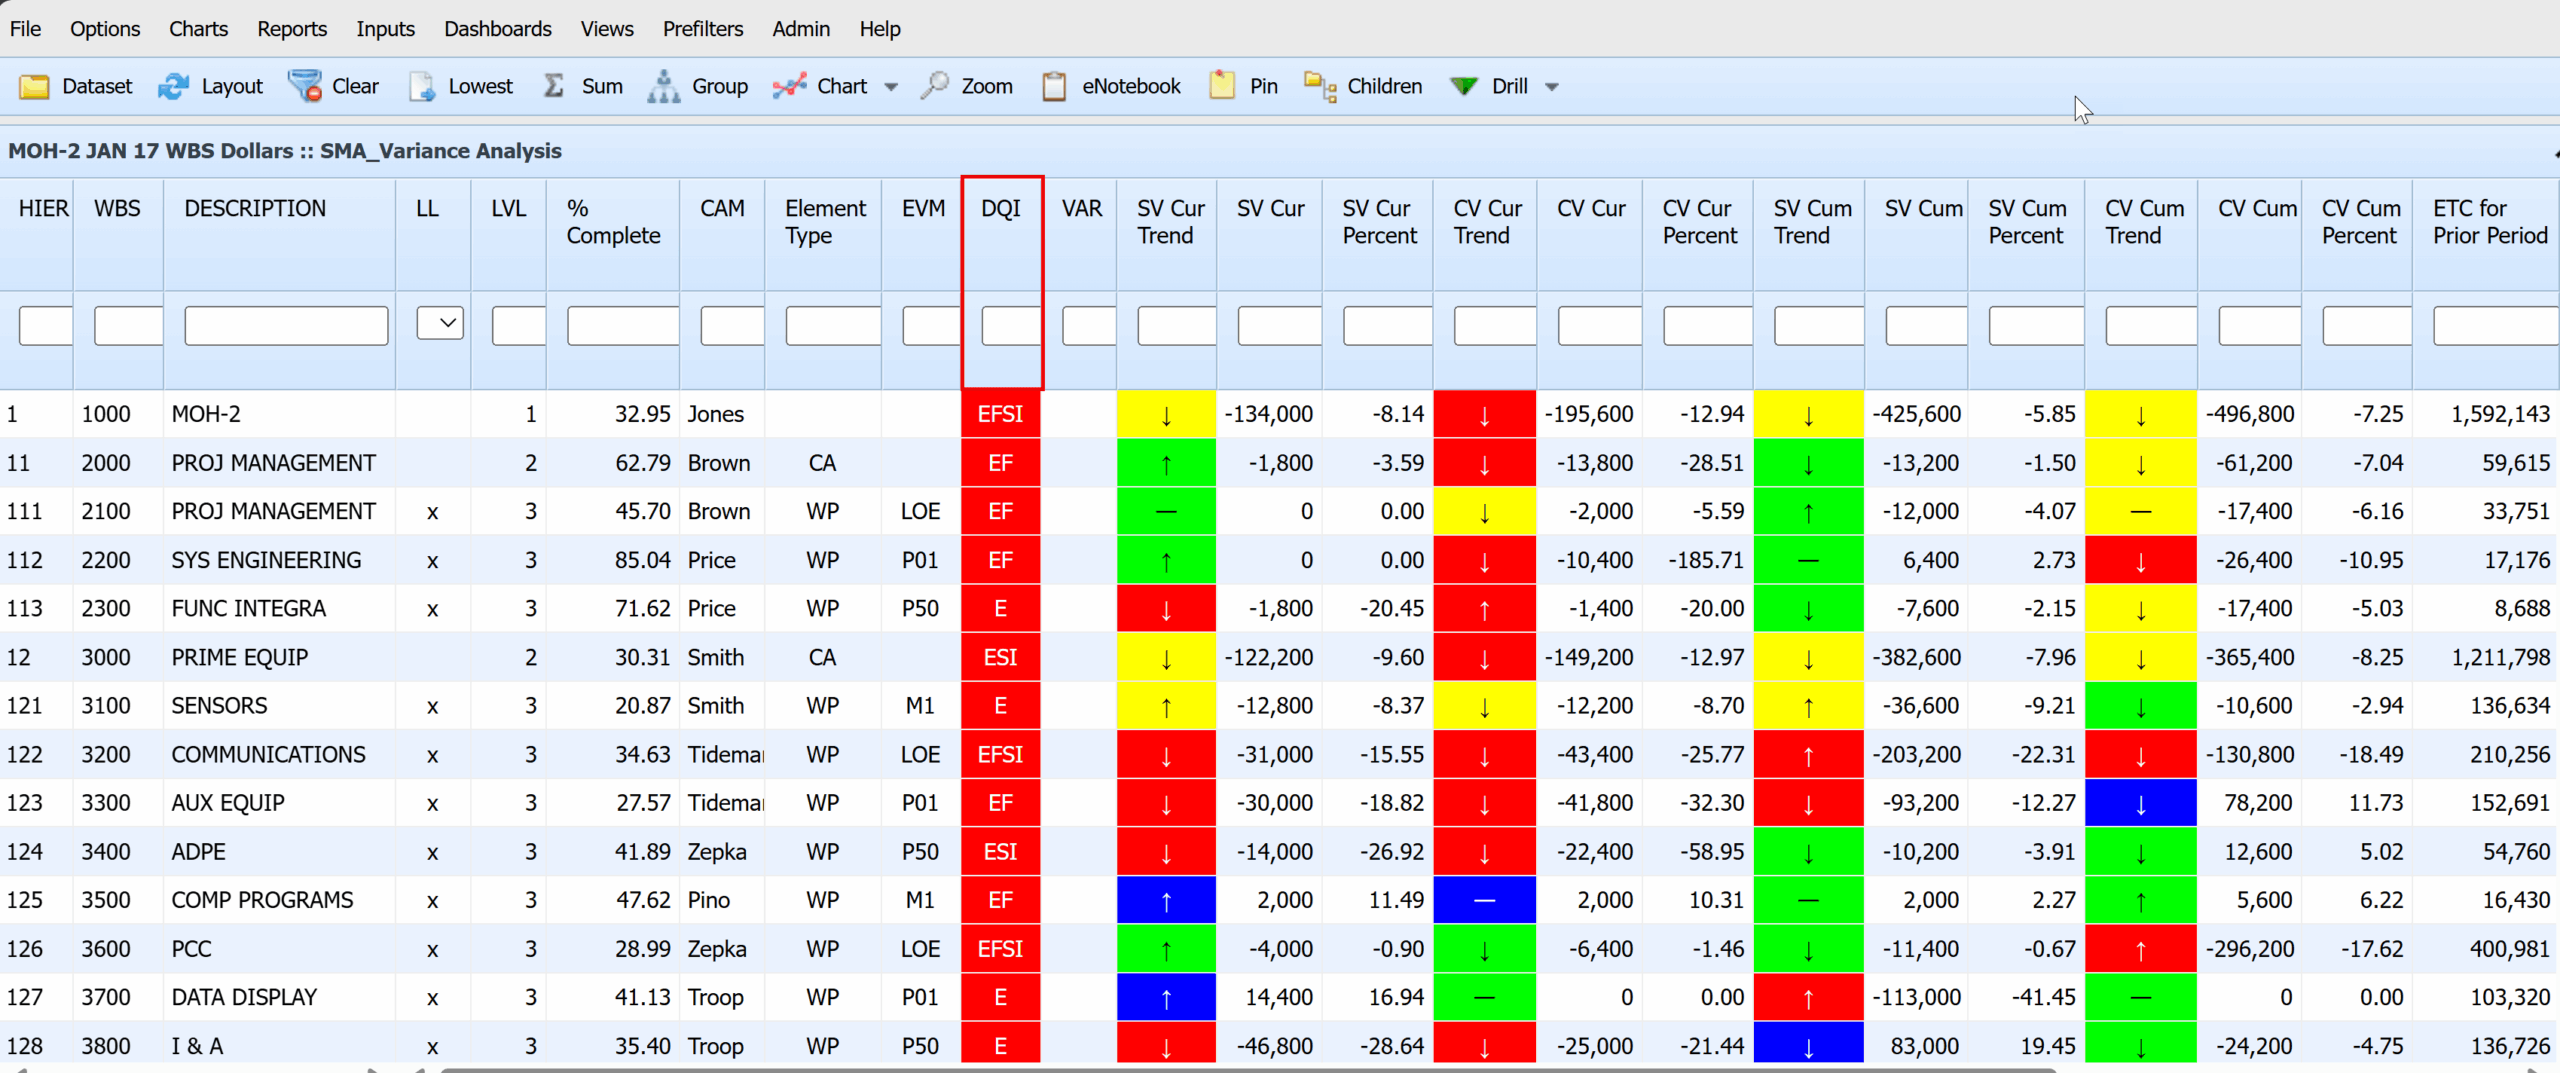
Select DQI Column
The SMA_Variance Analysis View contains the DQI Column for Data Quality Checks.
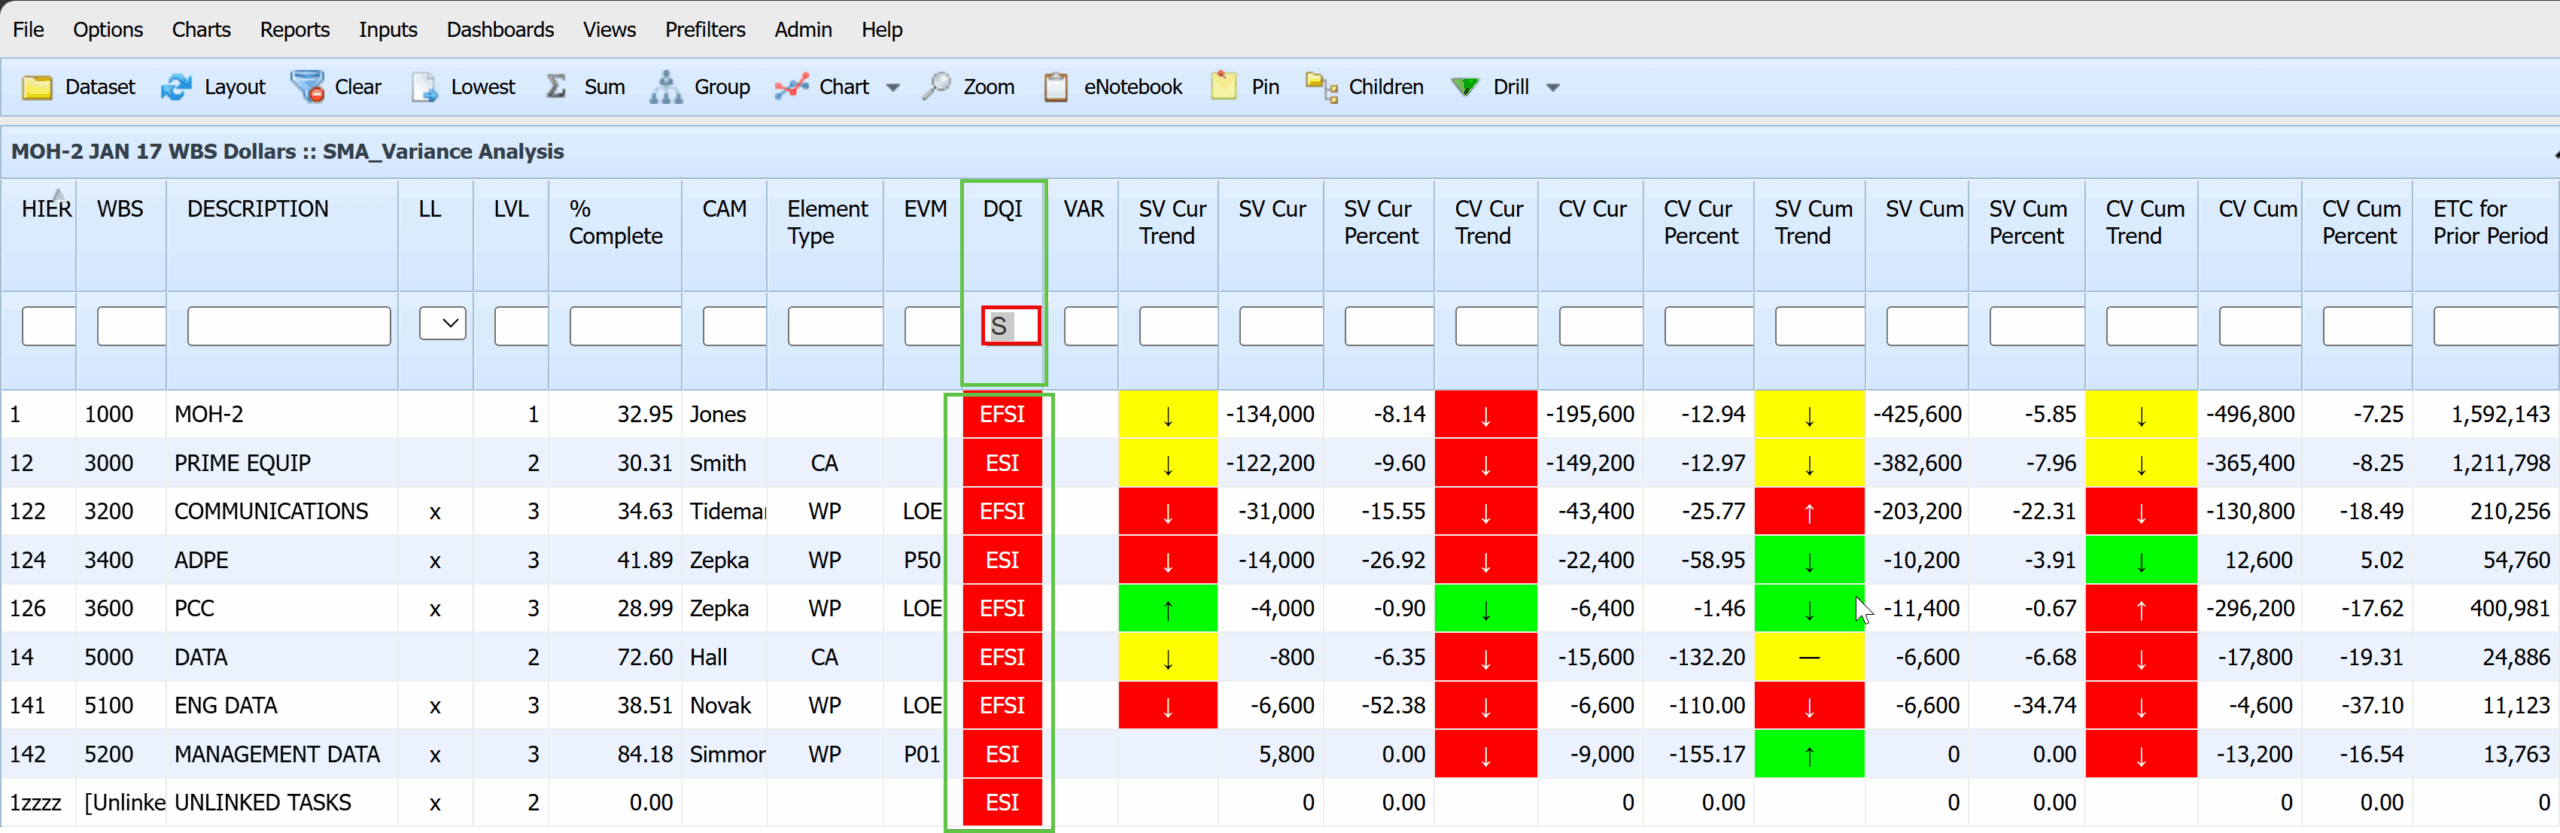
Apply Schedule DQI Filter – Schedule Anomalies
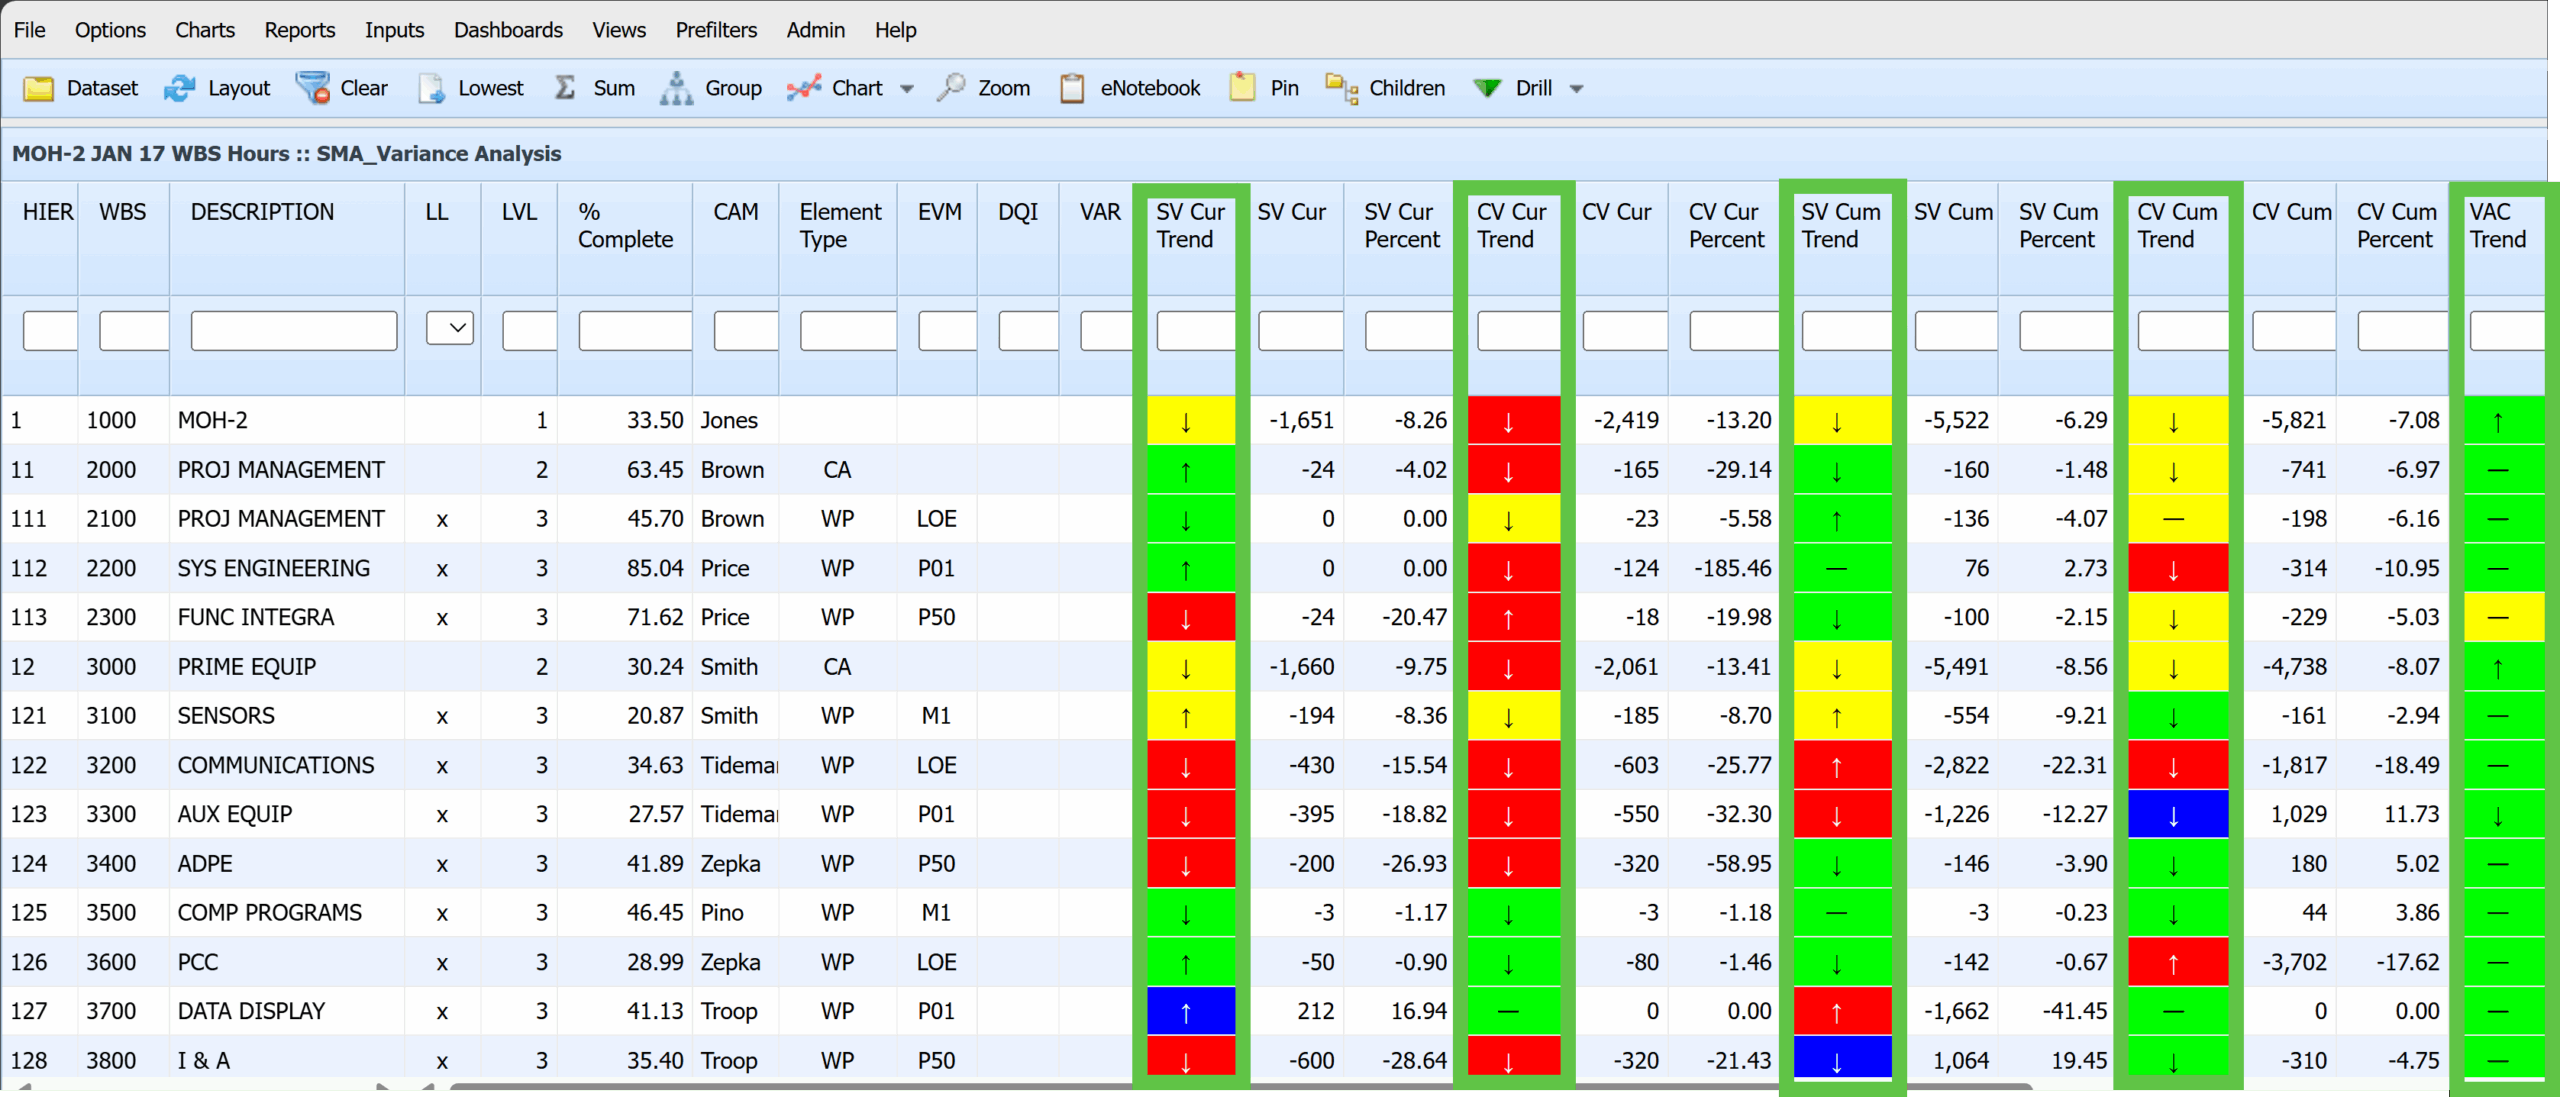
Color and Trends
The following columns highlighted are referred to as Color and Trend Columns:
| Variance Tend Column | Variance Description |
|---|---|
| SV Cur Trend | Schedule Variance Current Period Trend |
| CV Cur Trend | Cost Variance Current Period Variance Trend |
| SV Cum Trend | Schedule Variance Cumulative Variance Trend |
| CV Cum Trend | Cost Variance Cumulative Variance Trend |
| VAC Trend | Variance At Completion Trend |
In Empower, color trend columns are grouped into four main categories, each identified by a letter code:
Color Parameters
| Input | Result Description | Color |
|---|---|---|
| R | Red (Unsatisfactory) | Red |
| Y | Yellow (Marginal) | Yellow |
| G | Green (Satisfactory) | Green |
| B | Blue (Excellent) | Blue |
Trend Parameters
| Input | Result Description |
|---|---|
| U | Up (Conditions Improved) |
| D | Down (Conditions Worsened) |
| F | Flat (No Significant Change) |
| No Arrow | No Two Periods of Data |
Color and Trend Exercises
Entering a range of values in a column filters and shows only matching data, streamlining analysis.
Color Code Exercises
Unsatisfactory Results
To filter by color codes, type the initial letter of the color. For example, R for Red.
| Variance Tend Column | Variance Description | Input |
|---|---|---|
| SV Cur | Schedule Variance Current Period | R |
| CV Cur | Cost Variance Current Period Variance | R |
| SV Cum | Schedule Variance Cumulative Variance | R |
| CV Cum | Cost Variance Cumulative Variance | R |
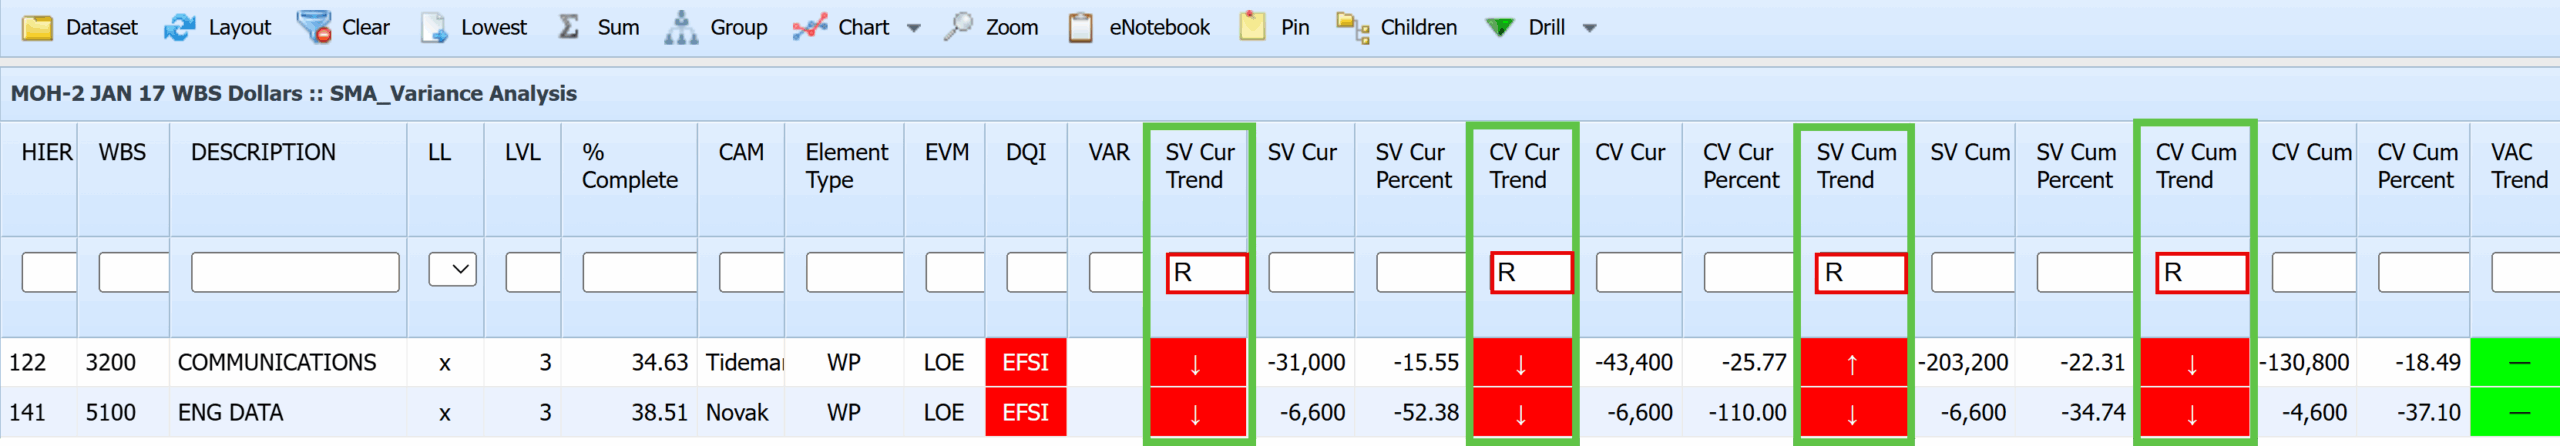
Using the interactive color filter on WBS Elements yielded unsatisfactory results based on SV Cur, CV Cur, SV Cum, and CV Cum variance thresholds since the last period;
| WBS | Description |
|---|---|
| 3200 | Communications |
| 5100 | Eng Data |
Excellent Results
To filter by color codes, type the initial letter of the color. For example, B for Blue:
| Variance Tend Column | Variance Description | Input |
|---|---|---|
| SV Cur | Schedule Variance Current Period | B |
| CV Cur | Cost Variance Current Period Variance | B |
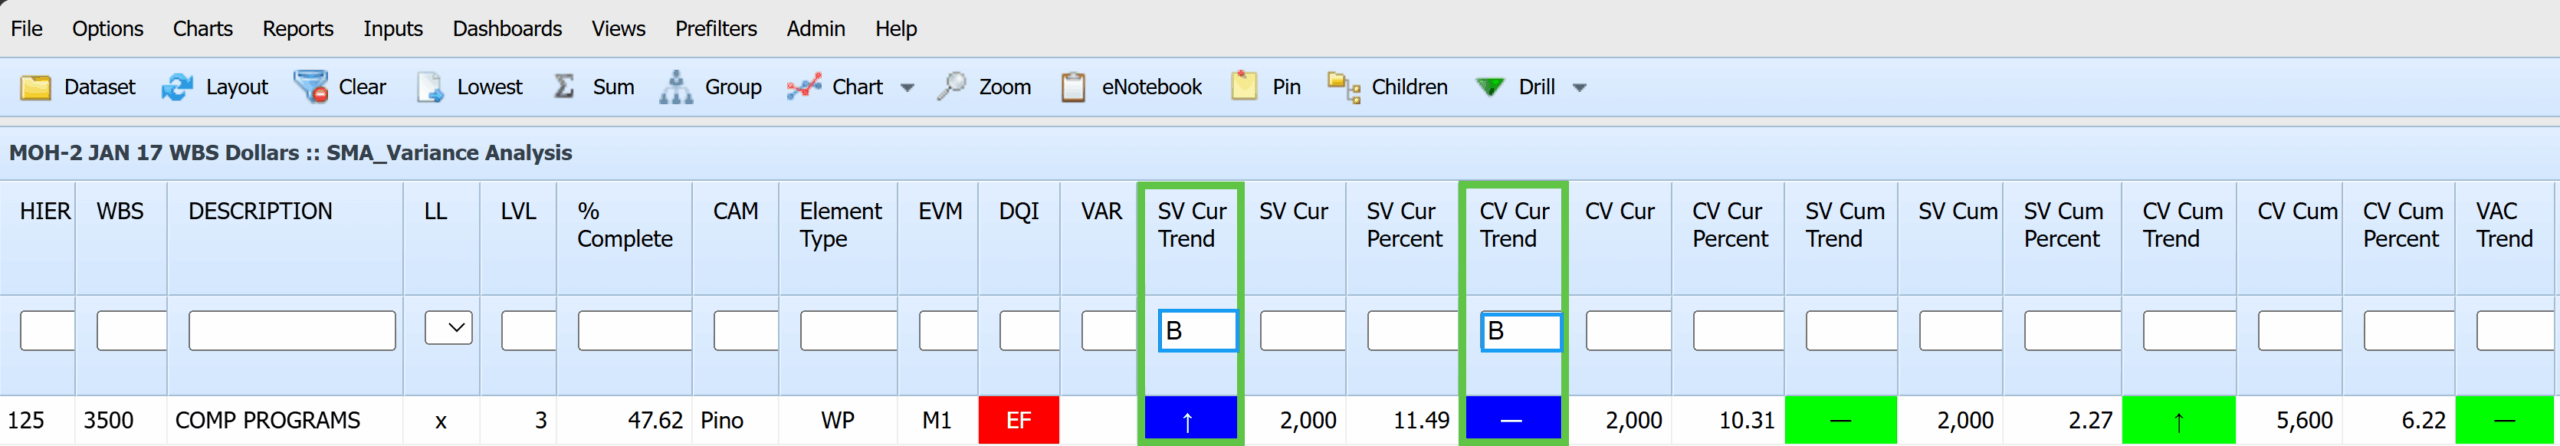
Applying the interactive color filter, the following WBS Element achieved excellent results for SV Cur Trend and CV Cur Trend based on the assigned variance thresholds since the last period:
| WBS | Description |
|---|---|
| 3500 | Comp Programs |
Trend Code Examples
Conditions Improved
To filter by trend codes, type the initial letter of the trend. For example, U for Up (↑)
| Variance Trend Column | Variance Description | Input |
|---|---|---|
| SV Cur | Schedule Variance Current Period | U |
| SV Cum | Schedule Variance Cumulative Variance | U |
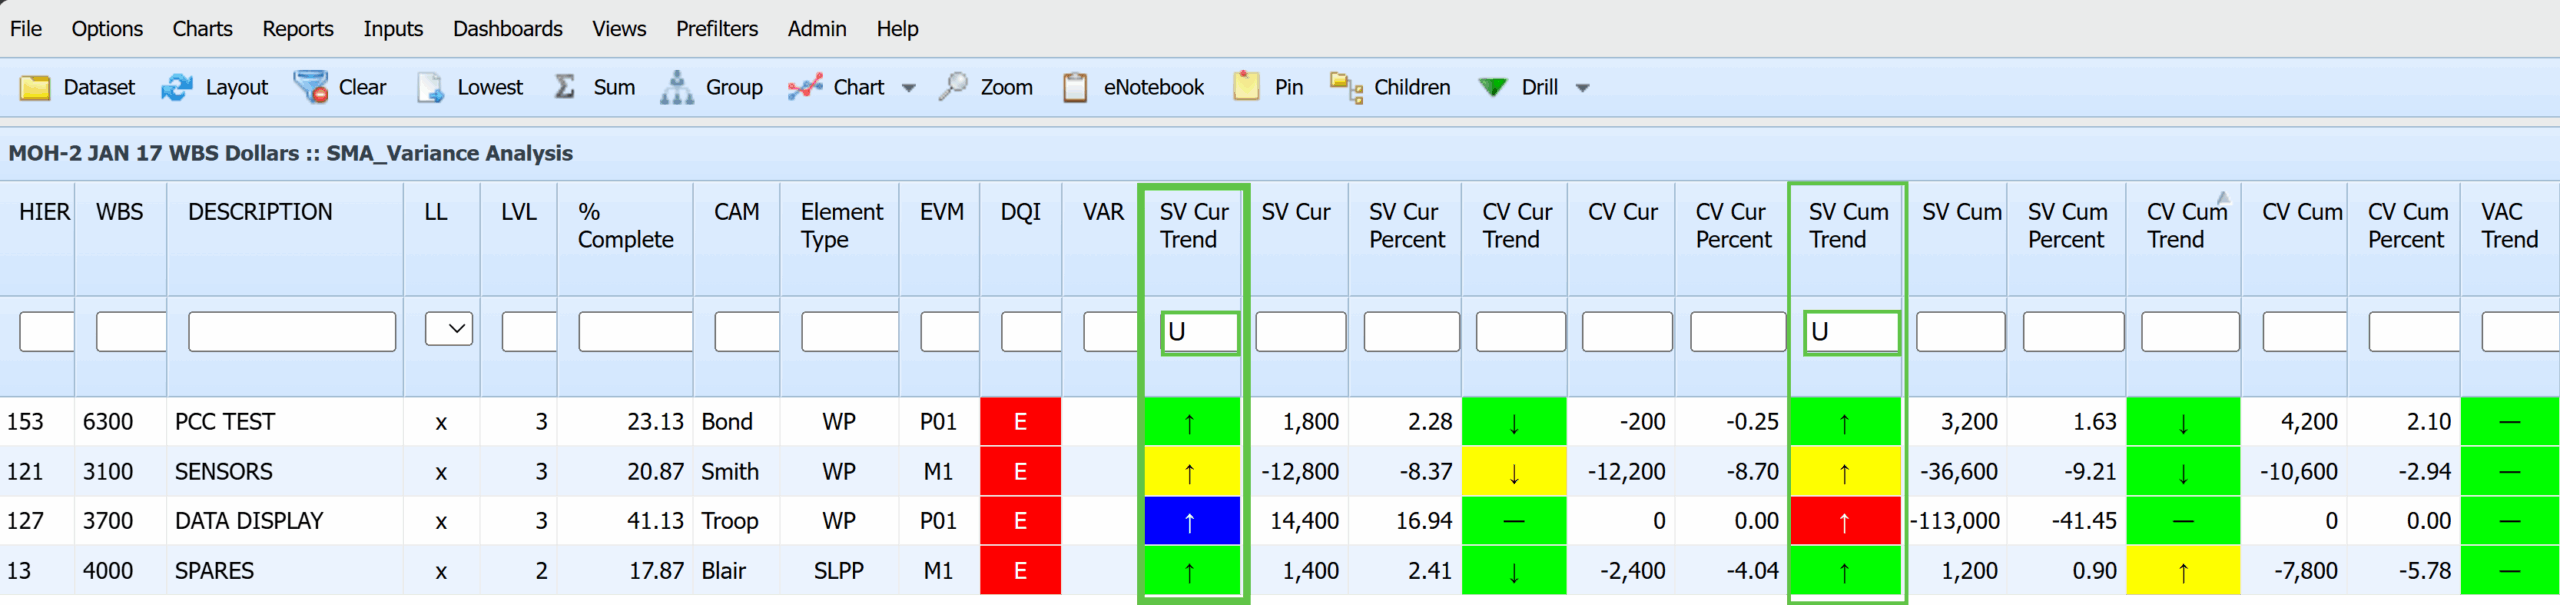
The application of the interactive trend filter has resulted in the following WBS Elements showing improved conditions based on the assigned variance thresholds for SV Cur and SV Cum Trends since last period:
| WBS | Description |
|---|---|
| 6300 | PCC Test |
| 3100 | Sensor |
| 3700 | Data Display |
| 4000 | Spares |
Conditions Worsened
To filter by trend codes, type the initial letter of the trend. For example, D for Down (↓)
VAC TrendVariance At Completion TrendD
| Variance Tend Column | Variance Description | Input |
|---|---|---|
| SV Cur Trend | Schedule Variance Current Period Trend | D |
| CV Cur Trend | Cost Variance Current Period Variance Trend | D |
| SV Cum Trend | Schedule Variance Cumulative Variance Trend | D |
| CV Cum Trend | Cost Variance Cumulative Variance Trend | D |
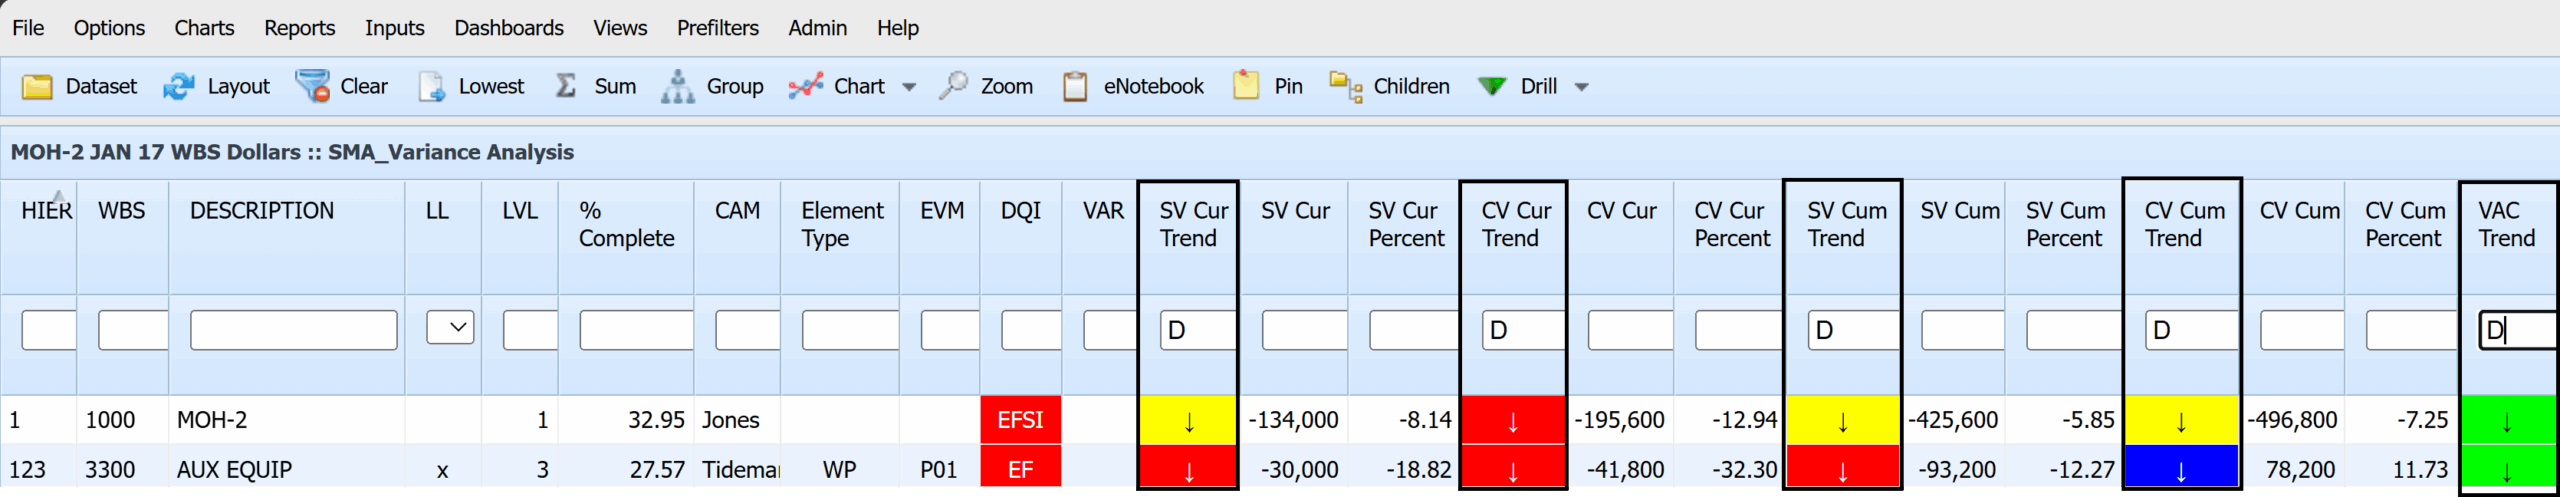
As a result of applying the above interactive trend filter, the following WBS Elements have shown a deterioration in conditions from the prior period trend results based on the variance thresholds assigned to these WBS elements for SV Cur, CV Cur, SV Cum, CV Cum, and VAC Trends:
| WBS | Description |
|---|---|
| 1000 | MOH2 |
| 3300 | AUX Equip |
Combined Color and Trend Direction Exercises
If specifying both color and direction, list color first. Users can enter either a color, a direction, or both. For example,
- “RD” gives all the elements with Red and ↓ arrows
- “RU” gives all the elements with Red and ↑ arrows,
- “F” gives all the elements with Flat or Sideways arrows.
To filter by color and trend, type the initial of the color followed by the trend parameter. For example, RD for Red Down (↓).
| Variance Tend Column | Variance Description | Input |
|---|---|---|
| SV Cur Trend | Schedule Variance Current Period Trend | RD |
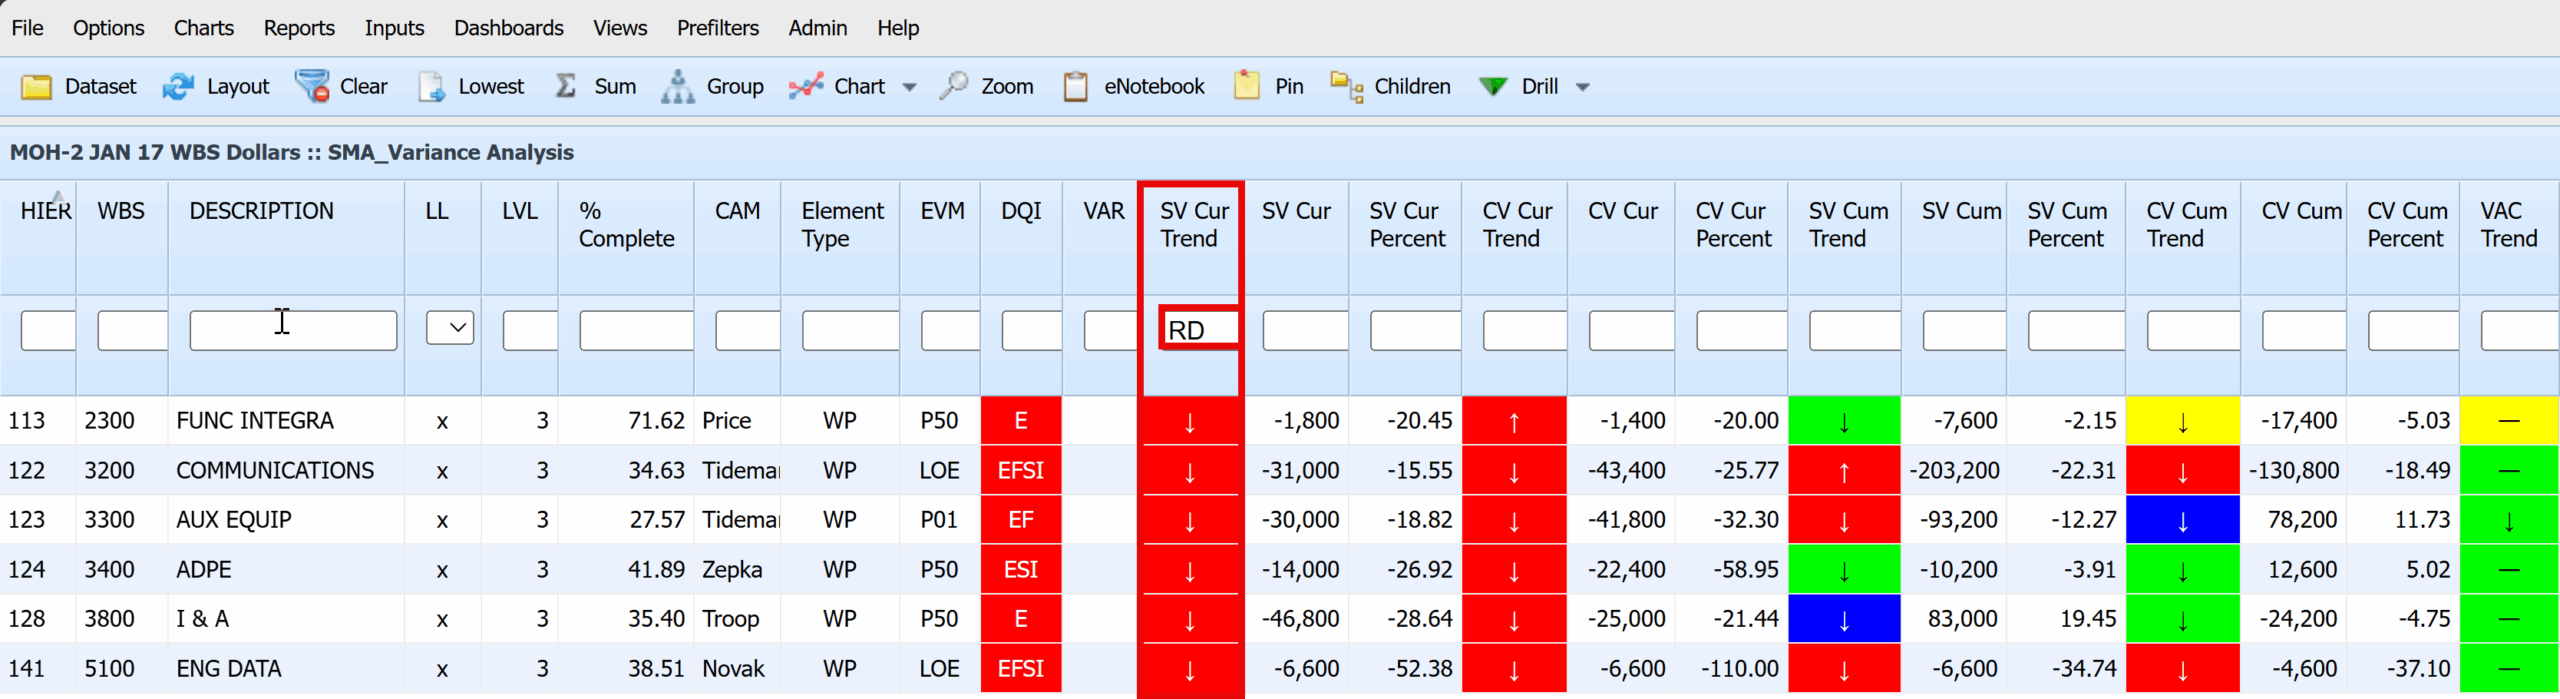
Applying the interactive color + trend filter revealed that the following WBS Elements are in unsatisfactory conditions and have worsened compared to the previous period, based on assigned variance thresholds for SV Cur:
| WBS | Description |
|---|---|
| 2300 | Func Integra |
| 3200 | Communications |
| 3300 | Aux Equip |
| 3400 | ADPE |
| 3800 | I&A |
| 5100 | Eng Data |
To filter by color and trend, type the initial of the color followed by the trend parameter. For example, YD for Yellow Down (↓).
| Variance Trend Column | Variance Description | Input |
|---|---|---|
| CV Cum Trend | Schedule Variance Current Period Trend | YD |
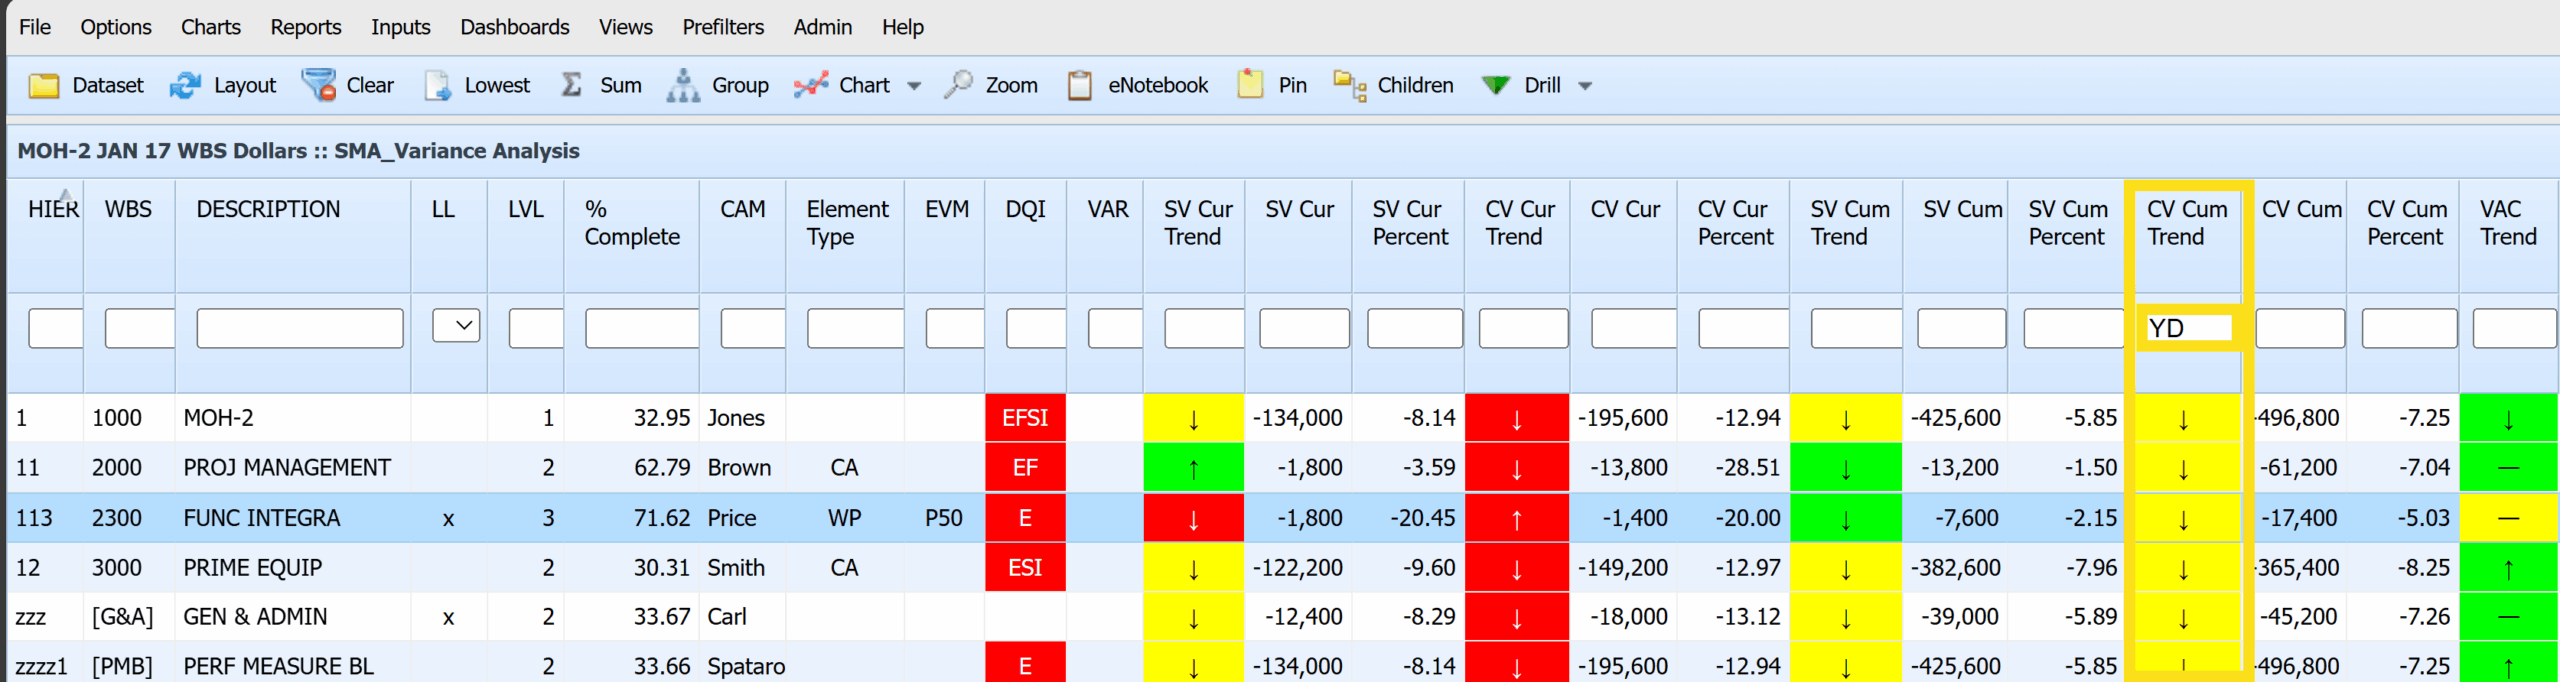
Applying the interactive color + trend filter revealed that the following WBS Elements are in marginal conditions and have worsened compared to the previous period, based on assigned variance thresholds for CV Cum:
| WBS | Description |
|---|---|
| 1000 | MOH-2 |
| 2000 | Proj Management |
| 2300 | Func Integra |
| 3000 | Prime Equip |
| [G&A] | Gen & Admin |
| [PMB] | Perf Measure BL |
Summary
Empower provides tools to identify problem areas, recognize trends, display cost information, graph schedule Gantt charts, gain insight into quality issues, and streamline the creation of narratives and corrective actions through integrated workflows. The primary advantage of interactive filters in Empower is that they facilitate real-time data analysis without requiring pre-set filters. Stakeholders involved in program management using Empower can effectively use program performance data for managing complex projects without needing extensive training or complicated Microsoft Windows desktop client installations.
 |
Alan Kristynik, PMP, GWCPM, is a Senior Associate in SMA’s Integrated Program Planning & Controls (IPPC) Practice, and has a Deltek Cobra Master Certification. He has been a Certified Project Management Professional with PMI since 1998, has an active DoD Top Secret clearance, and is a Subject Matter Expert in Earned Value Management Systems (EVMS). |
Posted on May 16, 2025, by
Dick Eassom, CF APMP Fellow, SMA, Inc.


