
6 minute read
Image: SMA, Inc. and Encore Analytics
March 28, 2025
A more in-depth instruction in the use of Sorts in Empower while analyzing project cost and schedule data.
By Alan Kristynik, PMP
Encore Analytics Empower is a server-based analytical tool that combines earned value, project schedule(s) and other key information to provide immediate productivity for Project Directors, Project/Program Managers, Control Account Managers, Project Controls Manager/Staff and Organizational Compliance personnel with rich, integrated and interactive system for proactive management of complex projects. Empower is specifically designed to quickly locate problem areas, identify trends, display element-of-cost information, graphically display schedule Gantt information, provide immediate insight into data quality issues.
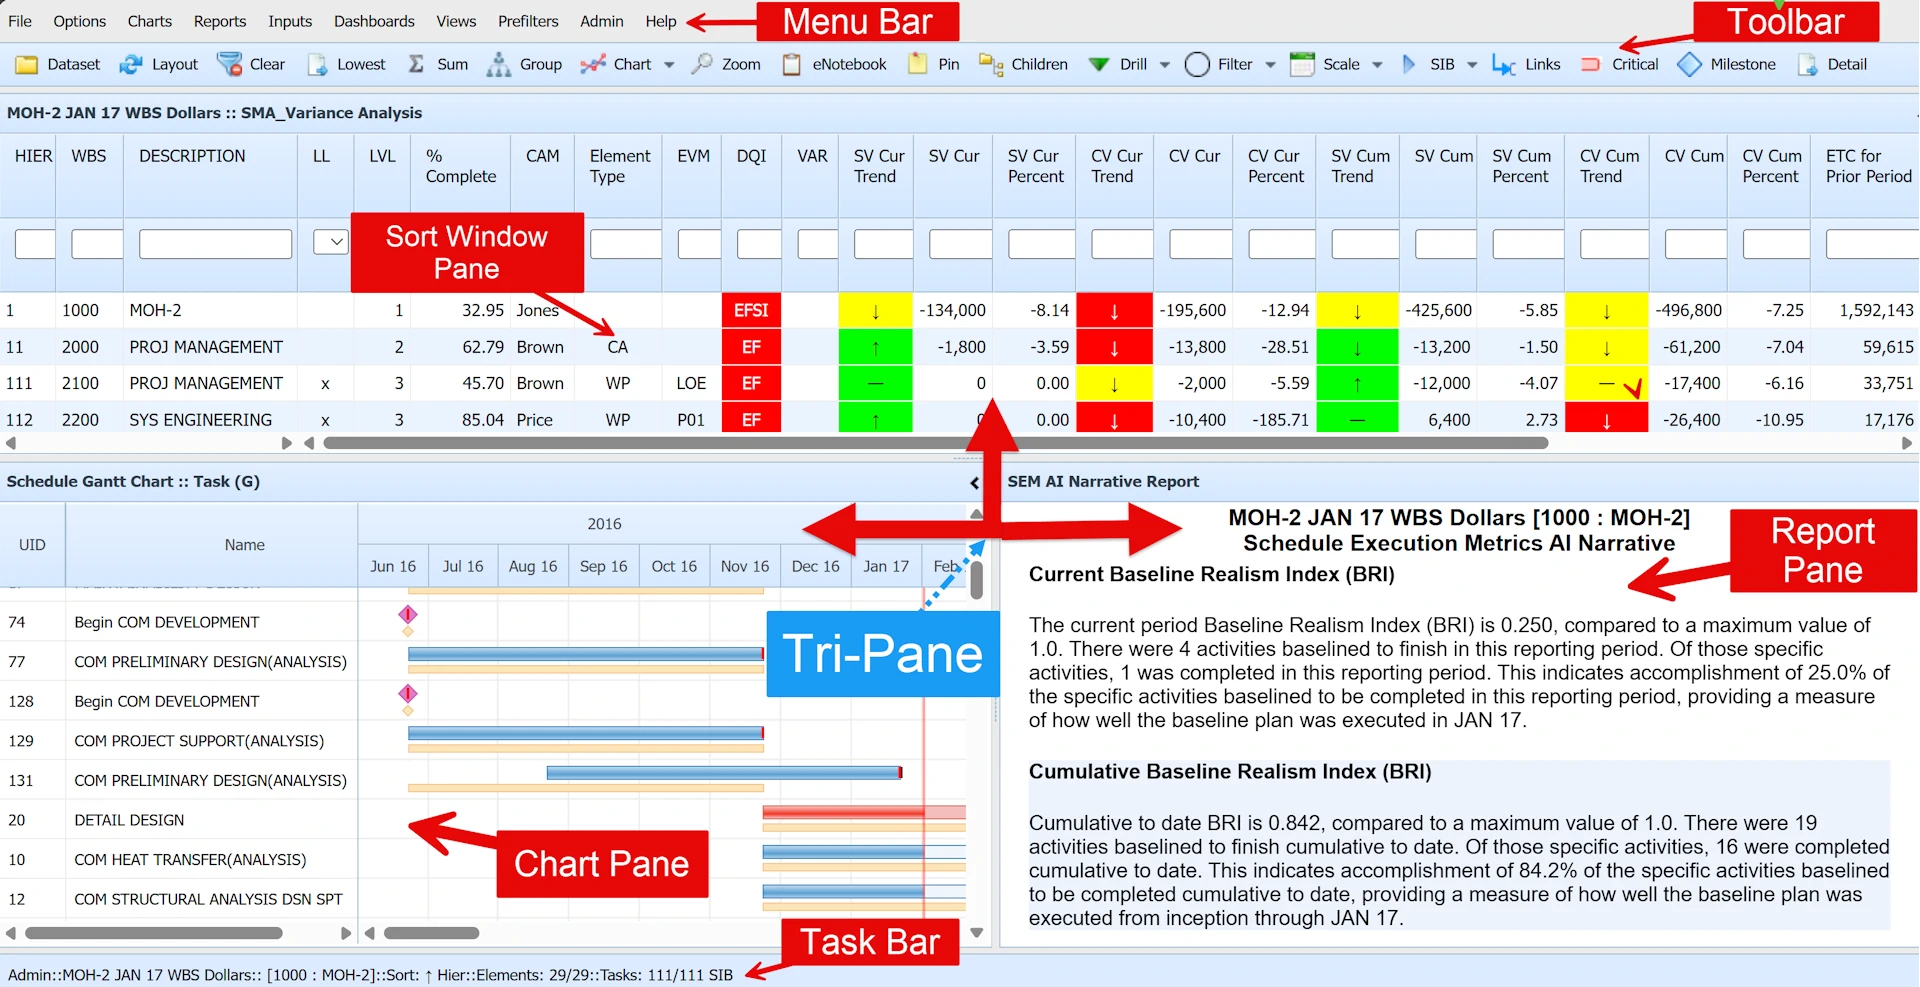
Empower Tri-Pane Layout
Empower presents information in three primary windows, called the Sort, Chart, and Report Windows. The Sort Window is at the top of the Empower window, with the Chart Window and Report Window side by side and below the Sort Window. This layout of the three primary windows is called the “Tripane” layout. Currently it is the only layout of the three windows available.
Introduction to Empower Views
Empower Views describes how to customize the appearance of the Sort Window by showing or hiding, reordering, and resizing columns. A collection of such settings is called a “view.” Switching views allows the user to move quickly from one collection of settings to another, and it is often helpful to use different views for different analysis tasks. Users can adjust the appearance of the Sort Window by controlling the visibility, order, and size of columns. A set of these configurations is referred to as a “view.” Global items are established by the Empower administrator, known as the “Admin” user, and are accessible to all Empower users. Conversely, User items are created or imported by a non-admin user and are exclusively available for that user’s use.
The Empower View Example below demonstrates how Empower utilization can be used for immediate productivity gains to quickly find problem areas and can be customized to your analysis requirements and preferences.
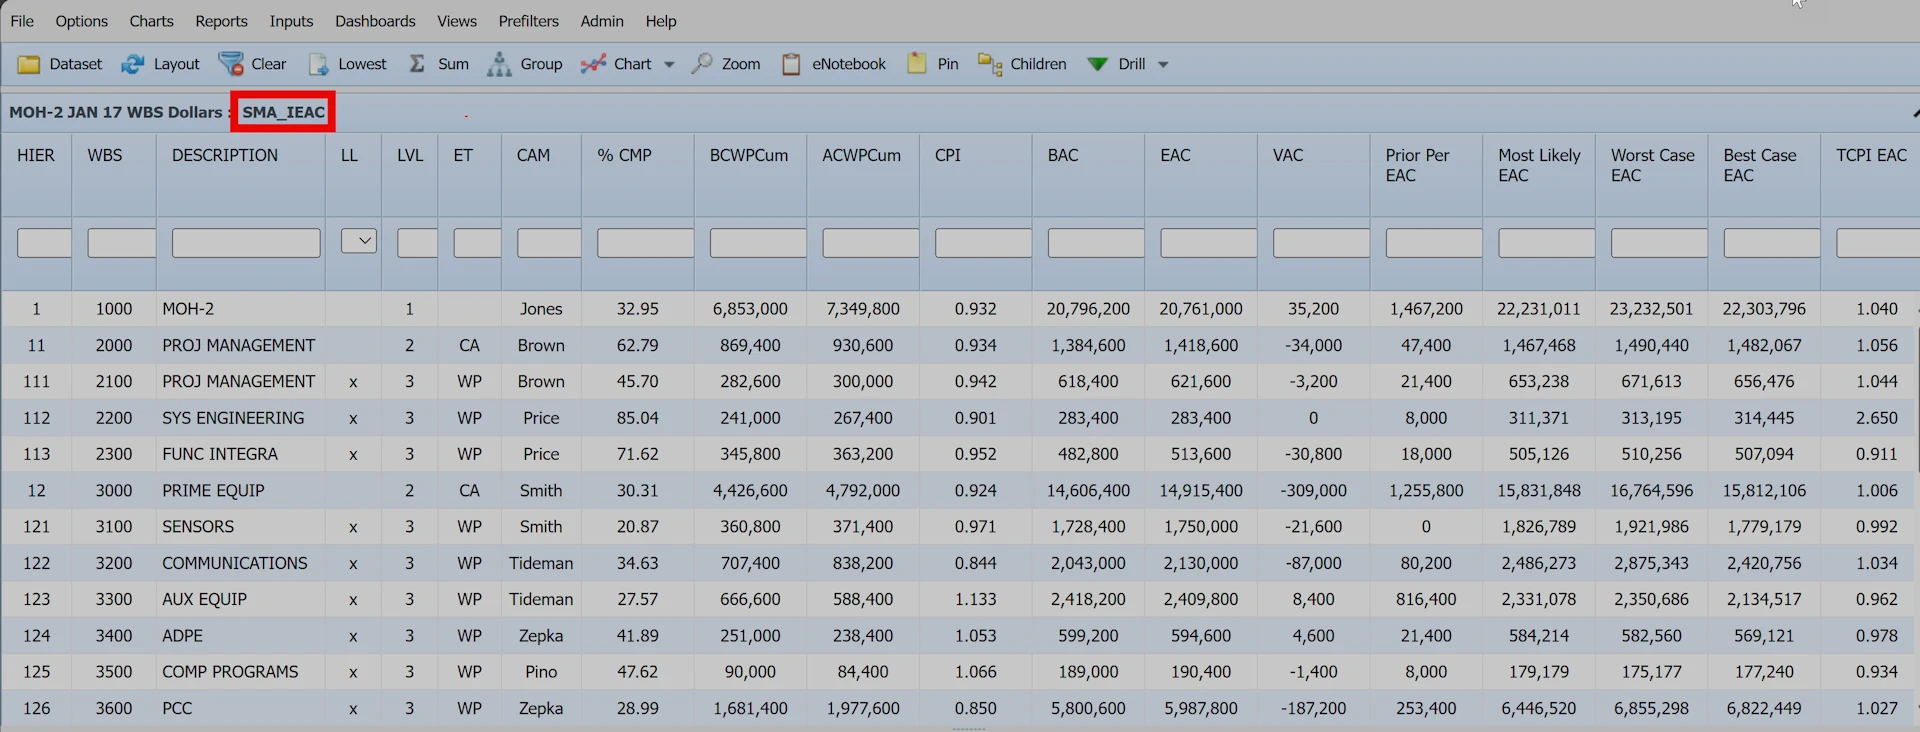
| Column | Name | Definition |
|---|---|---|
| HIER | Hierarchy | Project Hierarchy |
| WBS | Work Breakdown Structure | Project WBS |
| DESCRIPTION | Description | Element Description |
| LL | Lowest Level | Project Lowest Level |
| LVL | Level | Project Level |
| ET | Element Type | Element Type |
| CAM | Control Account Manager | Control Account Manager |
| % CMP | Percent Complete | Element Physical Percent Complete |
| BCWPCum | Cumulative Budgeted Cost of Work Performed | Earned value of completed work in terms of the work’s assigned budget |
| ACWPCum | Cumulative Actual Cost of Work Performed | The realized cost incurred for the work performed during a specific period |
| CPI | Cost Performance Index | An indicator of a project’s financial performance and efficiency |
| BAC | Budget At Completion | Total budget estimated for all project tasks |
| EAC | Estimate At Completion | The EAC represents the final project cost given the costs incurred to date and the expected costs to complete the project |
| VAC | Variance at Completion | The expected cost underrun or overrun by the end of a project |
| Prior Per EAC | Prior Period Estimate at Completion | The Prior Period EAC represents the final project cost given the costs incurred through prior period date and the expected costs to complete the project through prior period |
| Most Likely EAC | Most Likely (ML) Estimate at Completion | Statistical EAC Forecast Based Upon Weighted CPI and SPI |
| Worst Case EAC | Worst Case (WC) Estimate at Completion | Statistical EAC Forecast Based Upon Cumulative CPI * Cumulative SPI |
| Best Case EAC | Best Case (BC) Estimate at Completion | Statistical EAC Forecast Based Upon Cumulative CPI |
| TCPI EAC | To Complete Performance Index to the EAC | To Complete Performance Index to the EAC. It computes the future required cost efficiency needed to achieve a target Estimate at Completion (EAC). |
Sort View
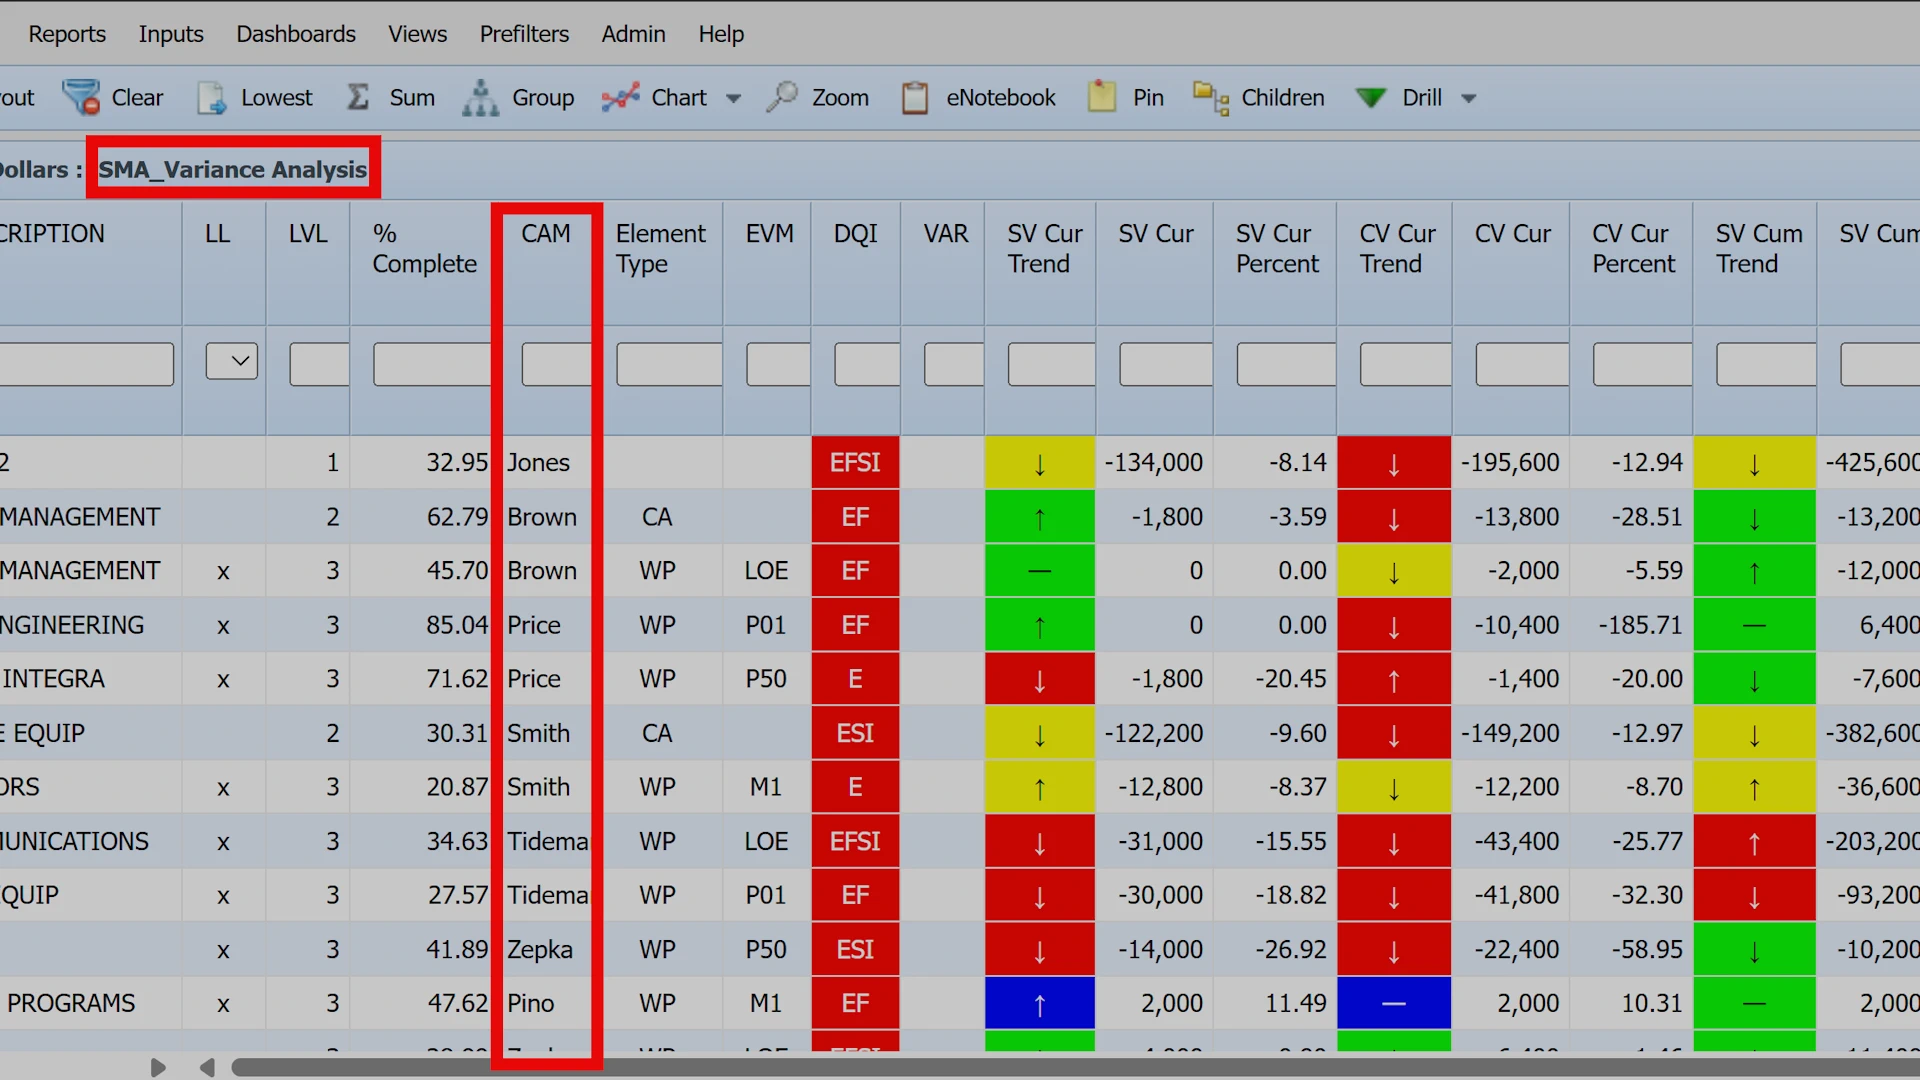
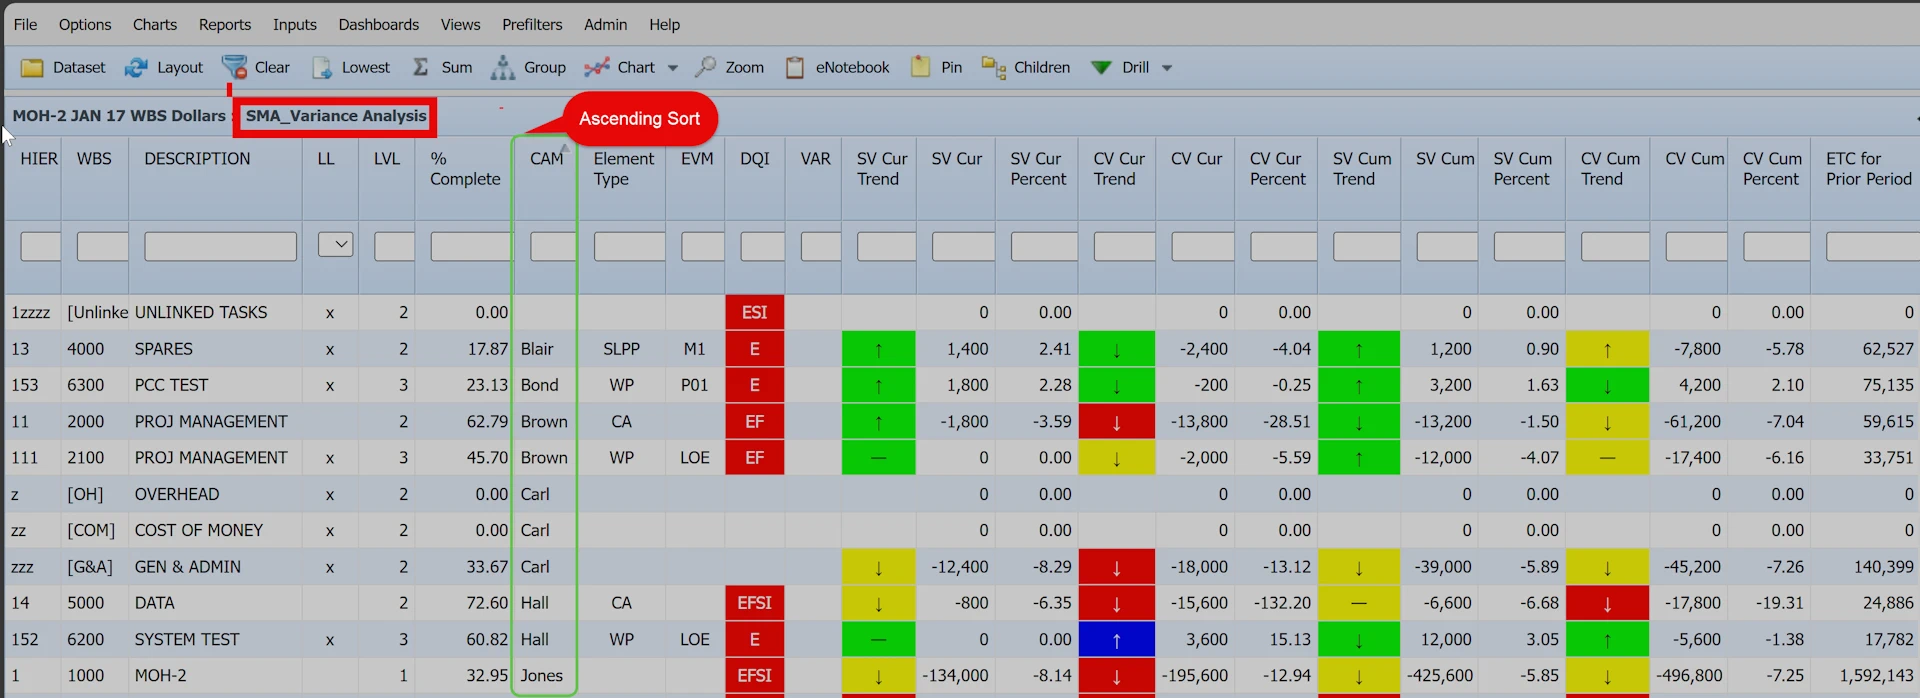
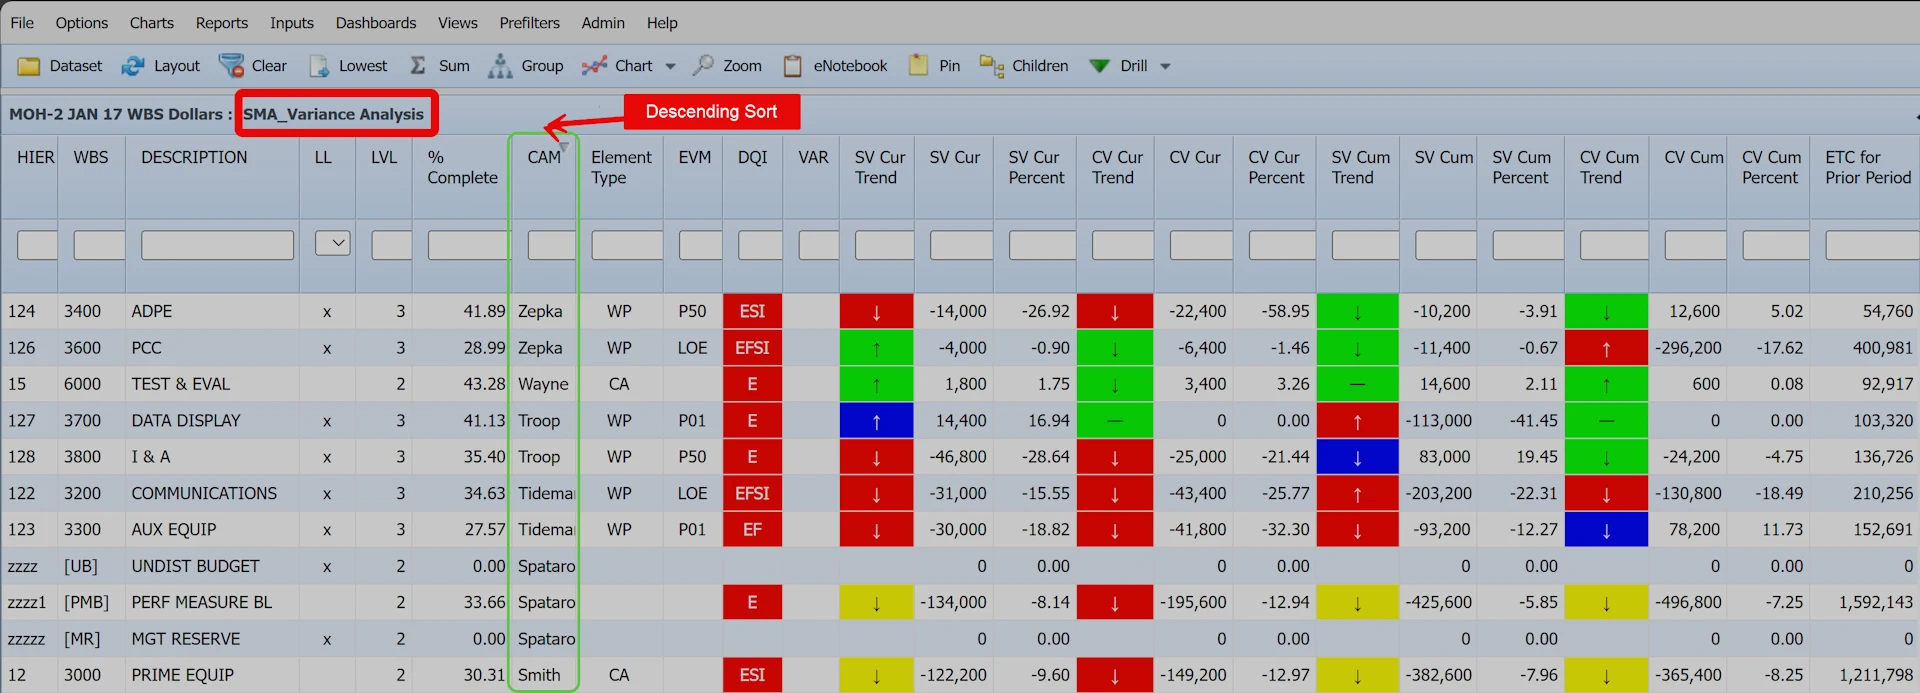
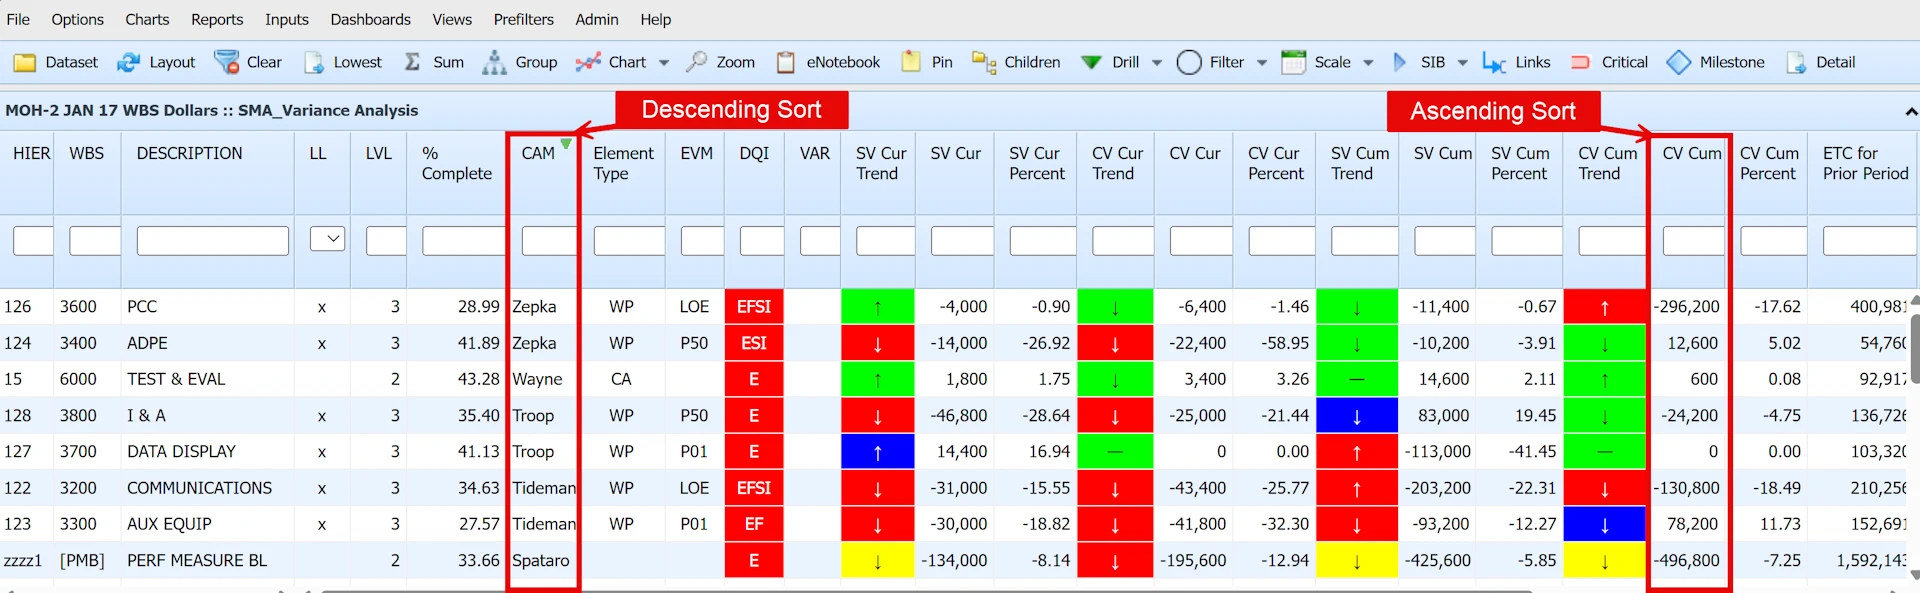
Using Sorts in Empower, conditions data by columns. The examples below will use a global view called SMA_Variance Analysis. The user can sort the rows by a left mouse click on the column header for the field to use as a Sort key. For example, to sort by CAM, left mouse click the header labelled CAM. The rows will be sorted in alphabetical order. A small arrow will appear in the column header to indicated that the CAM column is sorting the Sort window. The direction of the arrow (↑ or ↓) indicates whether the rows are being sorted in ascending or descending order.
CAM Field
Using the SMA_Variance Analysis Global View, no sort has been applied to the CAM Field:
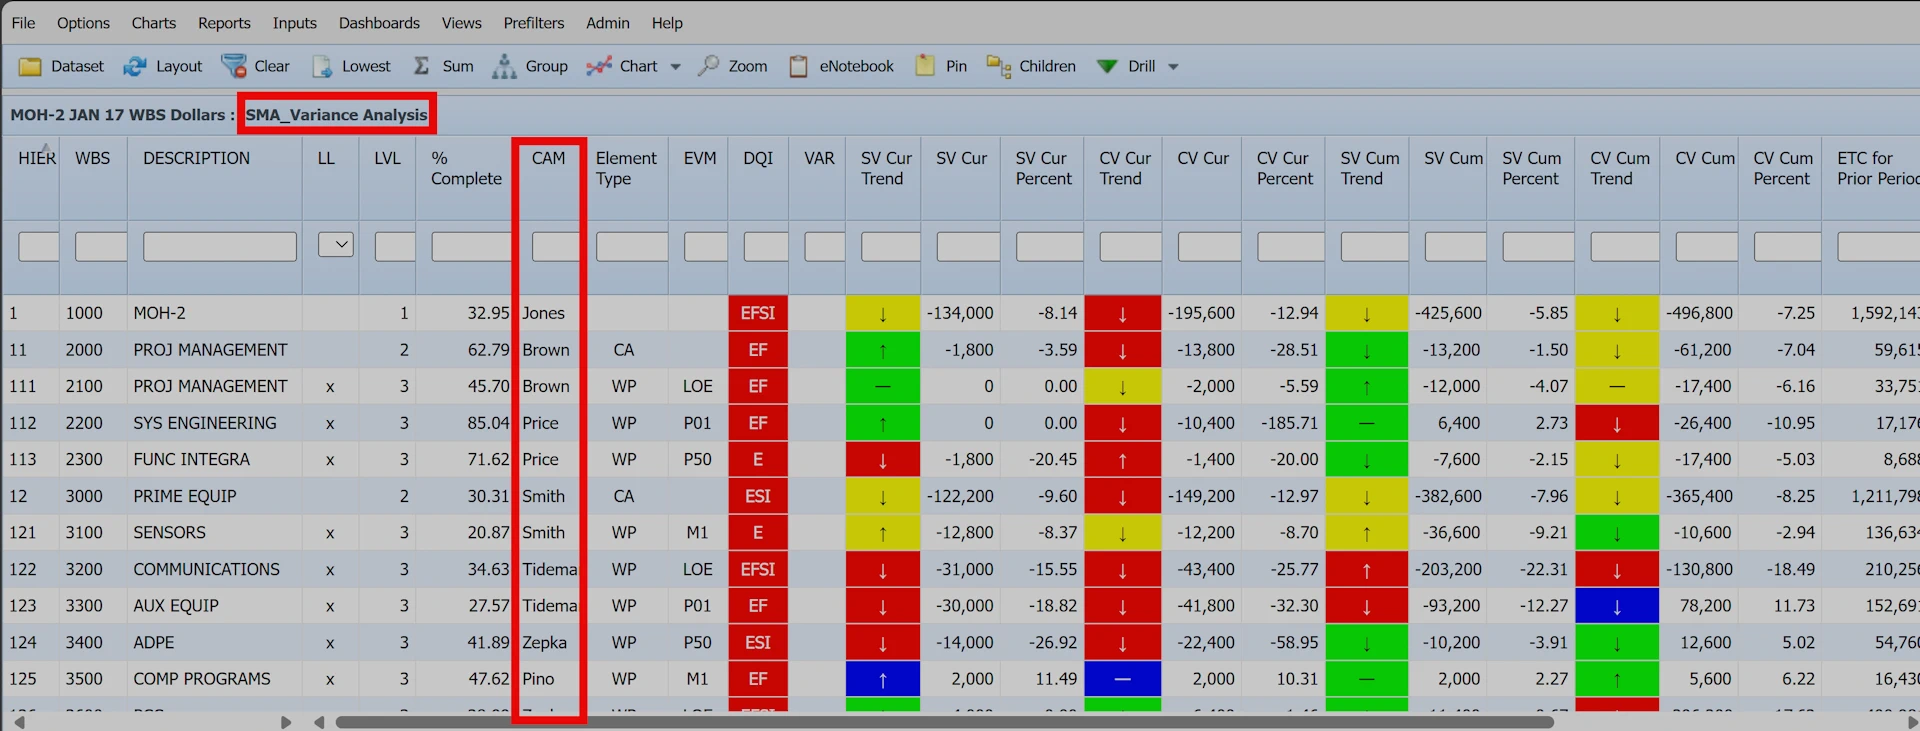
Using the SMA_Variance Analysis Global View, an Ascending Sort has been applied to the CAM Field:
Using the SMA_Variance Analysis Global View, a Descending Sort has been applied to the CAM Field:
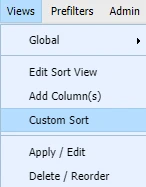
Custom Sorts
The “Custom Sort” dialog in Empower™ lets users sort columns by CAM Name and CVCum, with options for descending CAM and ascending CVCum. An arrow indicates the sort direction next to each column name. This helps organize project data efficiently. To apply the custom sort:
- Select Views > Custom Sort
- Choose CAM > Descending.
- Select CVCum > Ascending.
You can add or remove column fields to sort and organize project data efficiently if the column fields are in the current view selected:
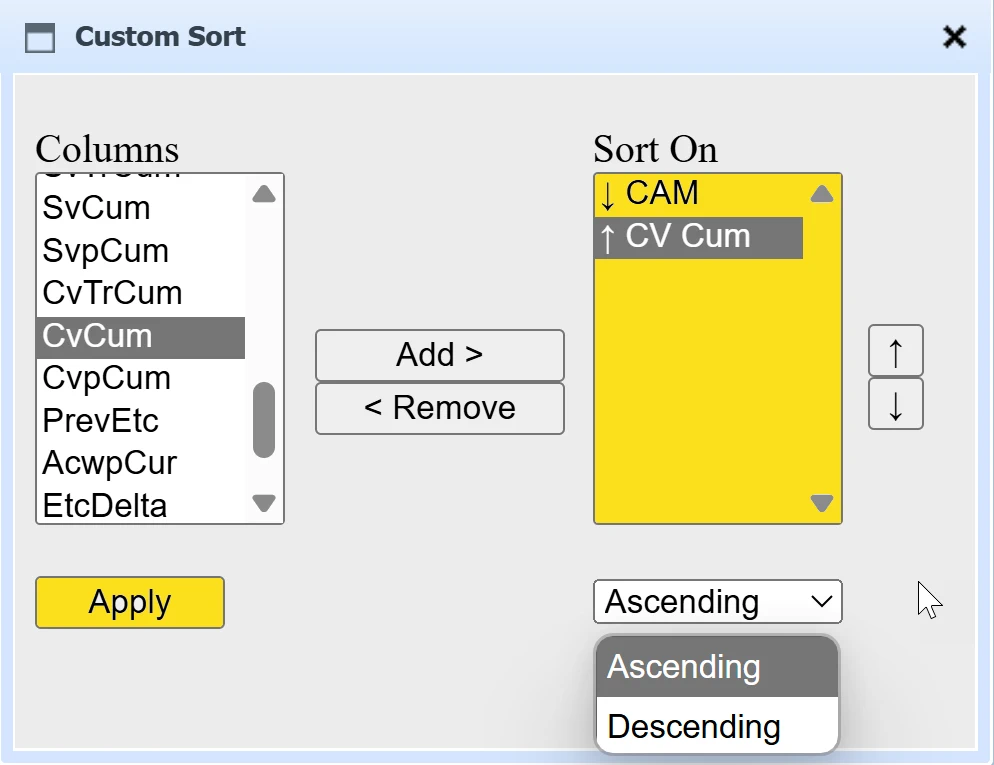
Note: Use the selection option at the dialog box’s bottom right to toggle column sort direction. Apply any available sort criteria linked to the current view. You will note below:
| CAM | Custom Sort | SVCum Value |
|---|---|---|
| ZepKa | Descending | 1. $ –296, 200 2. $ 12, 600 |
| Troop | Descending | 1. $ –24, 200 2. $ 0.00 |
| Tideman | Descending | 1. $130, 800 2. $ 78, 200 |
Summary
Empower will provide immediate productivity gains to quickly find problem areas, identify trends, display element-of-cost information, graphically display schedule Gantt information, immediate insight into quality issues and streamline the creation of narrative and corrective action with integrated workflows. With Empower, program management stakeholders no longer require extensive training or complicated Microsoft Windows desktop client installation to take full advantage of program performance data to aid in the initiative-taking management of complex projects.
Next Empower Topic: Filtering Project Data Interactively
Using interactive filters in Empower conditions data by rows. Interactive filtering is best for when you want to create a filter on the fly; you just fill in the filter criteria in the filter bar above the Sort Window.
 |
Alan Kristynik, PMP, GWCPM, is a Senior Associate in SMA’s Integrated Program Planning & Controls (IPPC) Practice, and has a Deltek Cobra Master Certification. He has been a Certified Project Management Professional with PMI since 1998, has an active DoD Top Secret clearance, and is a Subject Matter Expert in Earned Value Management Systems (EVMS). |
Posted on March 28, 2025, by
Dick Eassom, CF APMP Fellow, SMA, Inc.


