

8 minute read
Image: Song_about_summer at stock.adobe.com
December 3, 2025
A more in-depth instruction in the use of Filters Interactively in Empower while analyzing project cost and schedule data
By Alan Kristynik, PMP
Encore Analytics Empower is a server-based analytical tool that combines earned value, project schedule(s) and other key information to provide immediate productivity for Project Directors, Project/Program Managers, Control Account Managers, Project Controls Manager/Staff and Organizational Compliance personnel with rich, integrated and interactive system for proactive management of complex projects. Empower is specifically designed to quickly locate problem areas, identify trends, display element-of-cost information, graphically display schedule Gantt information, provide immediate insight into data quality issues.
Introduction
The purpose and scope of this paper are to provide users with detailed guidance on using Interactive Filters for analyzing project cost and schedule data. The interactive filter parameters covered in this third of a three-part series include:
- Gantt Filter
- Gantt Scale Filter
- Gantt Mode Filters:
- Cost Mode Filter
- Task Mode Filter:
- Relationships
- Siblings
- Trace Back
- Trace Forward
- Gantt Links Filter
- Gantt Critical Tasks Filter
- Gantt Milestone Filter
- Gantt Detail Filter
- Global Pre-Filters
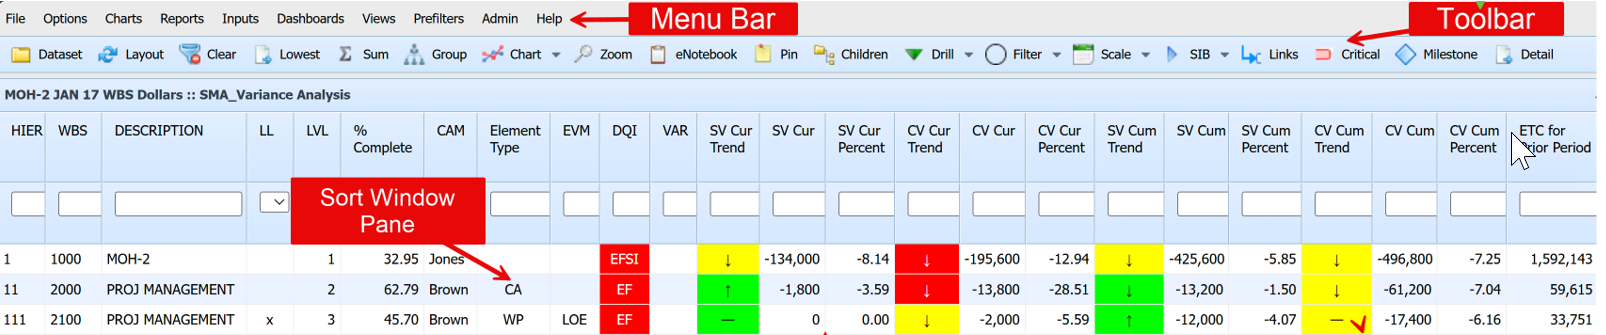
Empower Sort Window
Empower presents information in three primary windows, called the Sort, Chart, and Report windows. The Sort Window is at the top of the Empower window, with the Chart Window and Report Window side-by-side and below the Sort Window.
For the purpose and scope of this topic, Interactive Filters, our focus is primarily with the Sort Window as seen below.
Gantt Toolbar
When opened normally, Gantt Views are applied to the Gantt Chart in the chart pane. Filter buttons narrow down the activities that are displayed in the schedule.
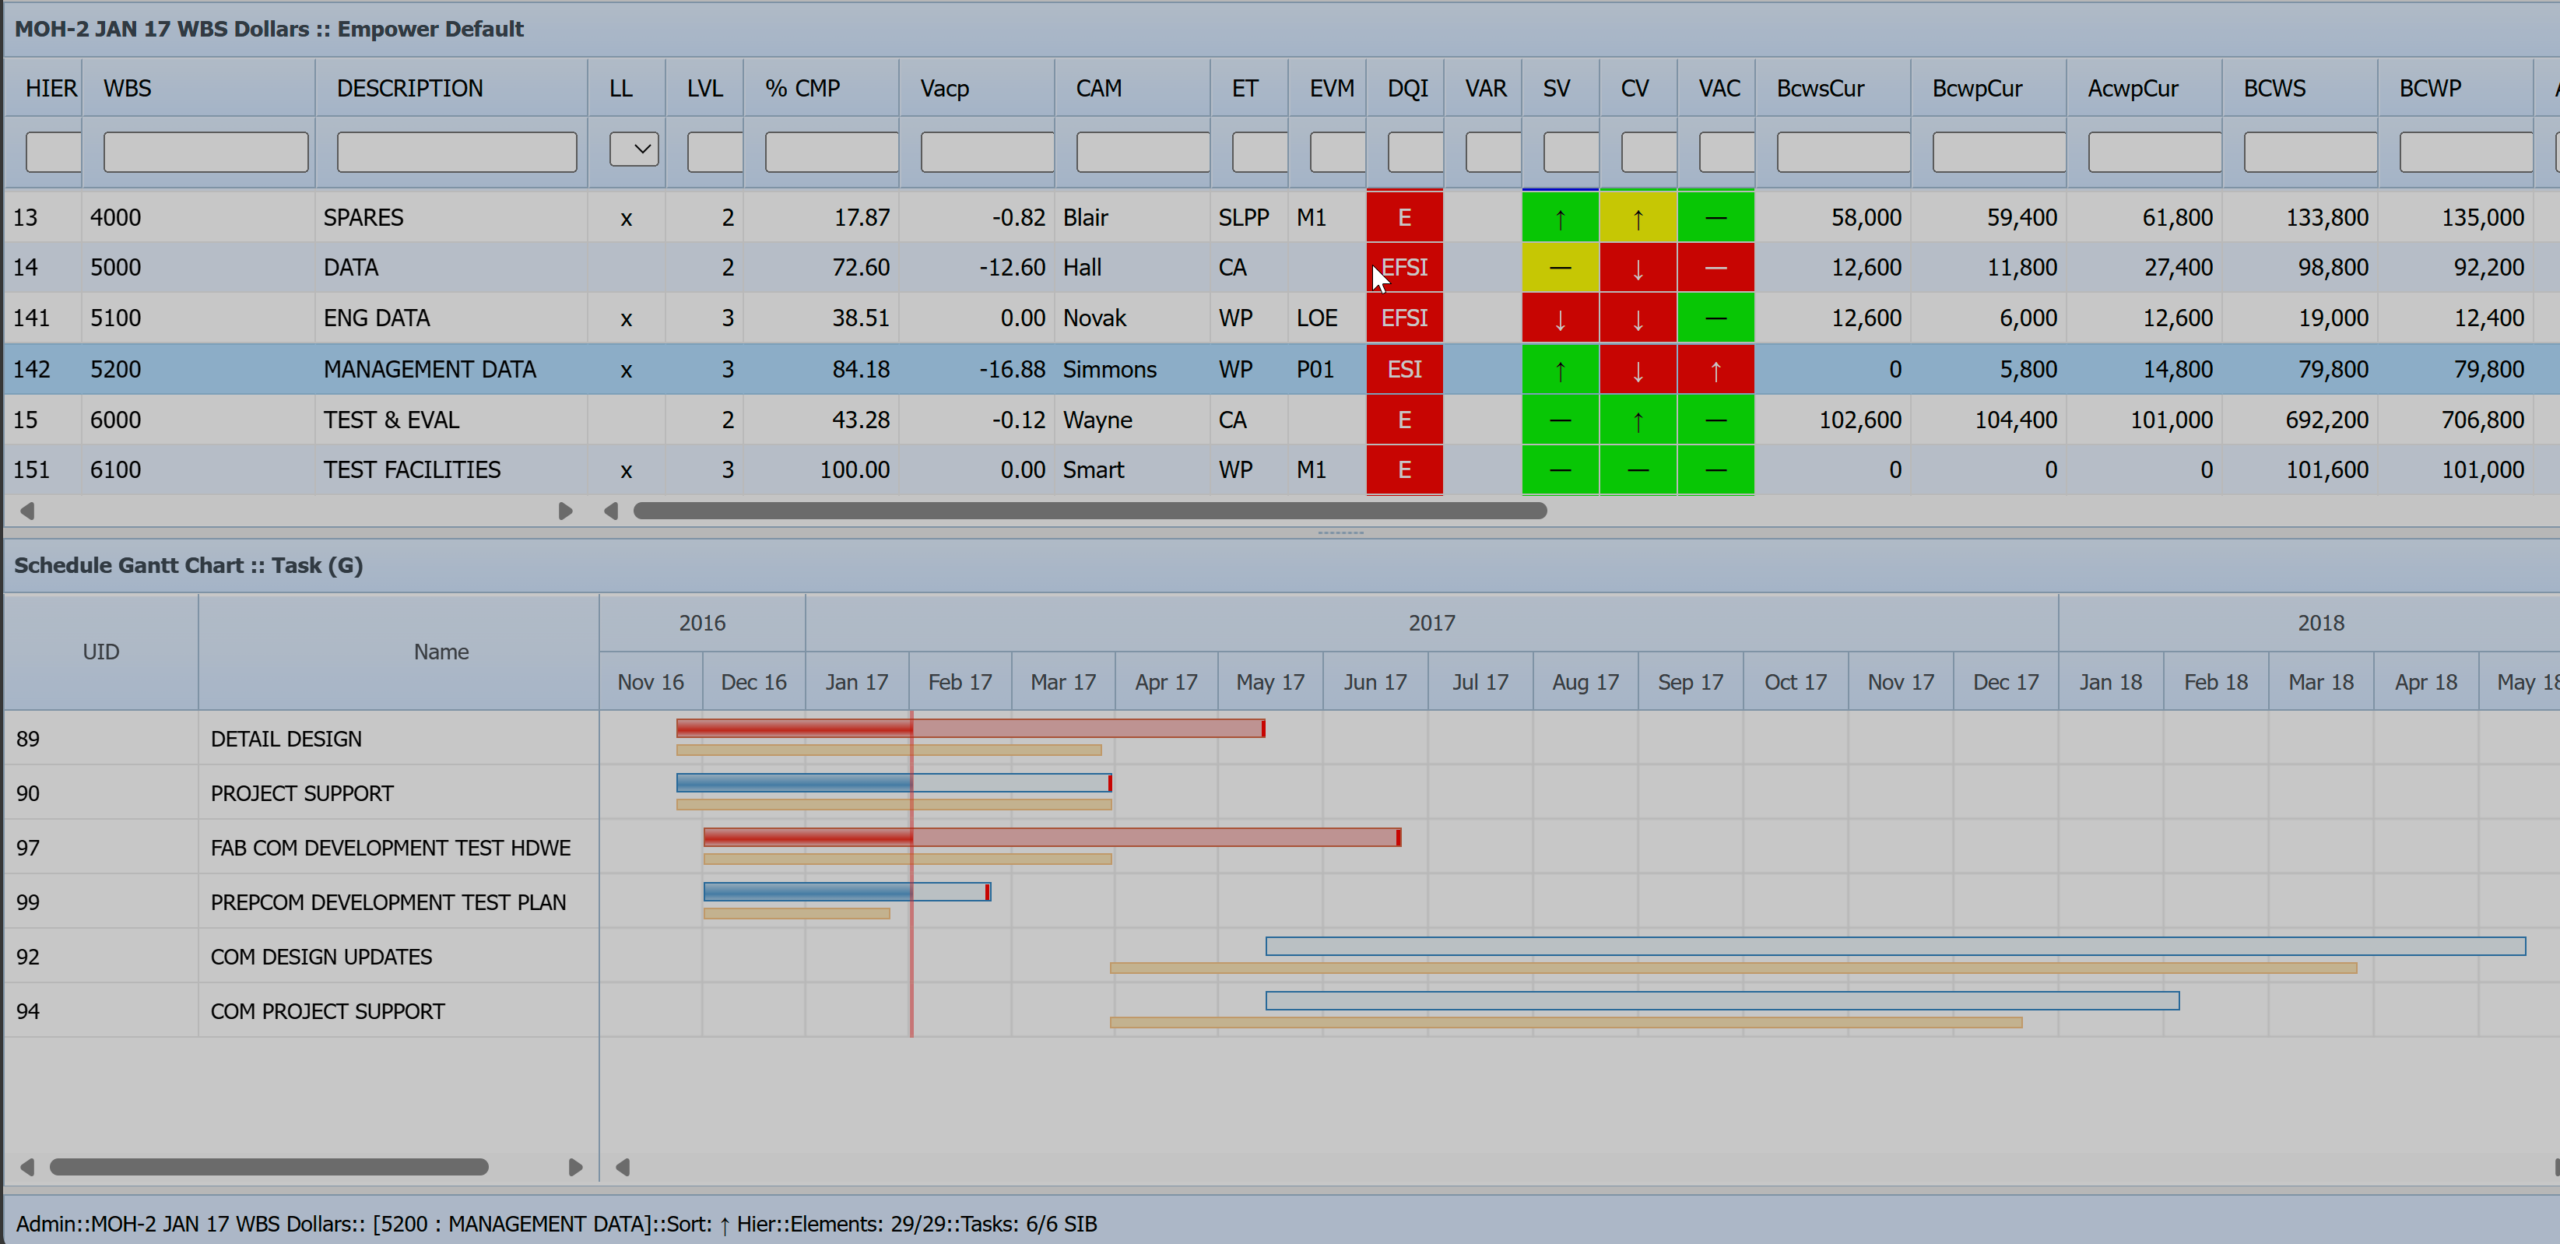
When the Schedule Gantt Chart is open, the Gantt Toolbar will display at the right end of the main Toolbar:
![]()
The Gantt Toolbar is only visible when the Gantt chart is displayed. Note that the Filter and Scale buttons have dropdown lists for quick access to the various options.
Gantt Filter Button
The Gantt Filter button is used to filter the schedule activities based upon the Red, Yellow, Green and White criteria built into Empower.
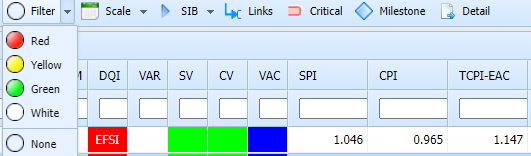
| Filter | Filter Criteria |
|---|---|
| Red |
|
| Yellow |
|
| Green |
|
| White | All completed tasks |
| Clear | Filter not applied |
| Slip Count: Did a finish variance occur during this period? | |
| Slip Value: Finish Variance = Forecast Finish = Baseline Finish | |
You can select the Filter button to toggle between the last color selected and “None,” or use the dropdown list to jump directly to your selection.
Gantt Scale Button
The Gantt Scale button changes the timescale in the Gantt chart between quarters, months, or weeks. Clicking on the button will toggle through the various options or you can use the dropdown list to jump directly to your selection.

Gantt Scale Drop Down Menu – Quarters
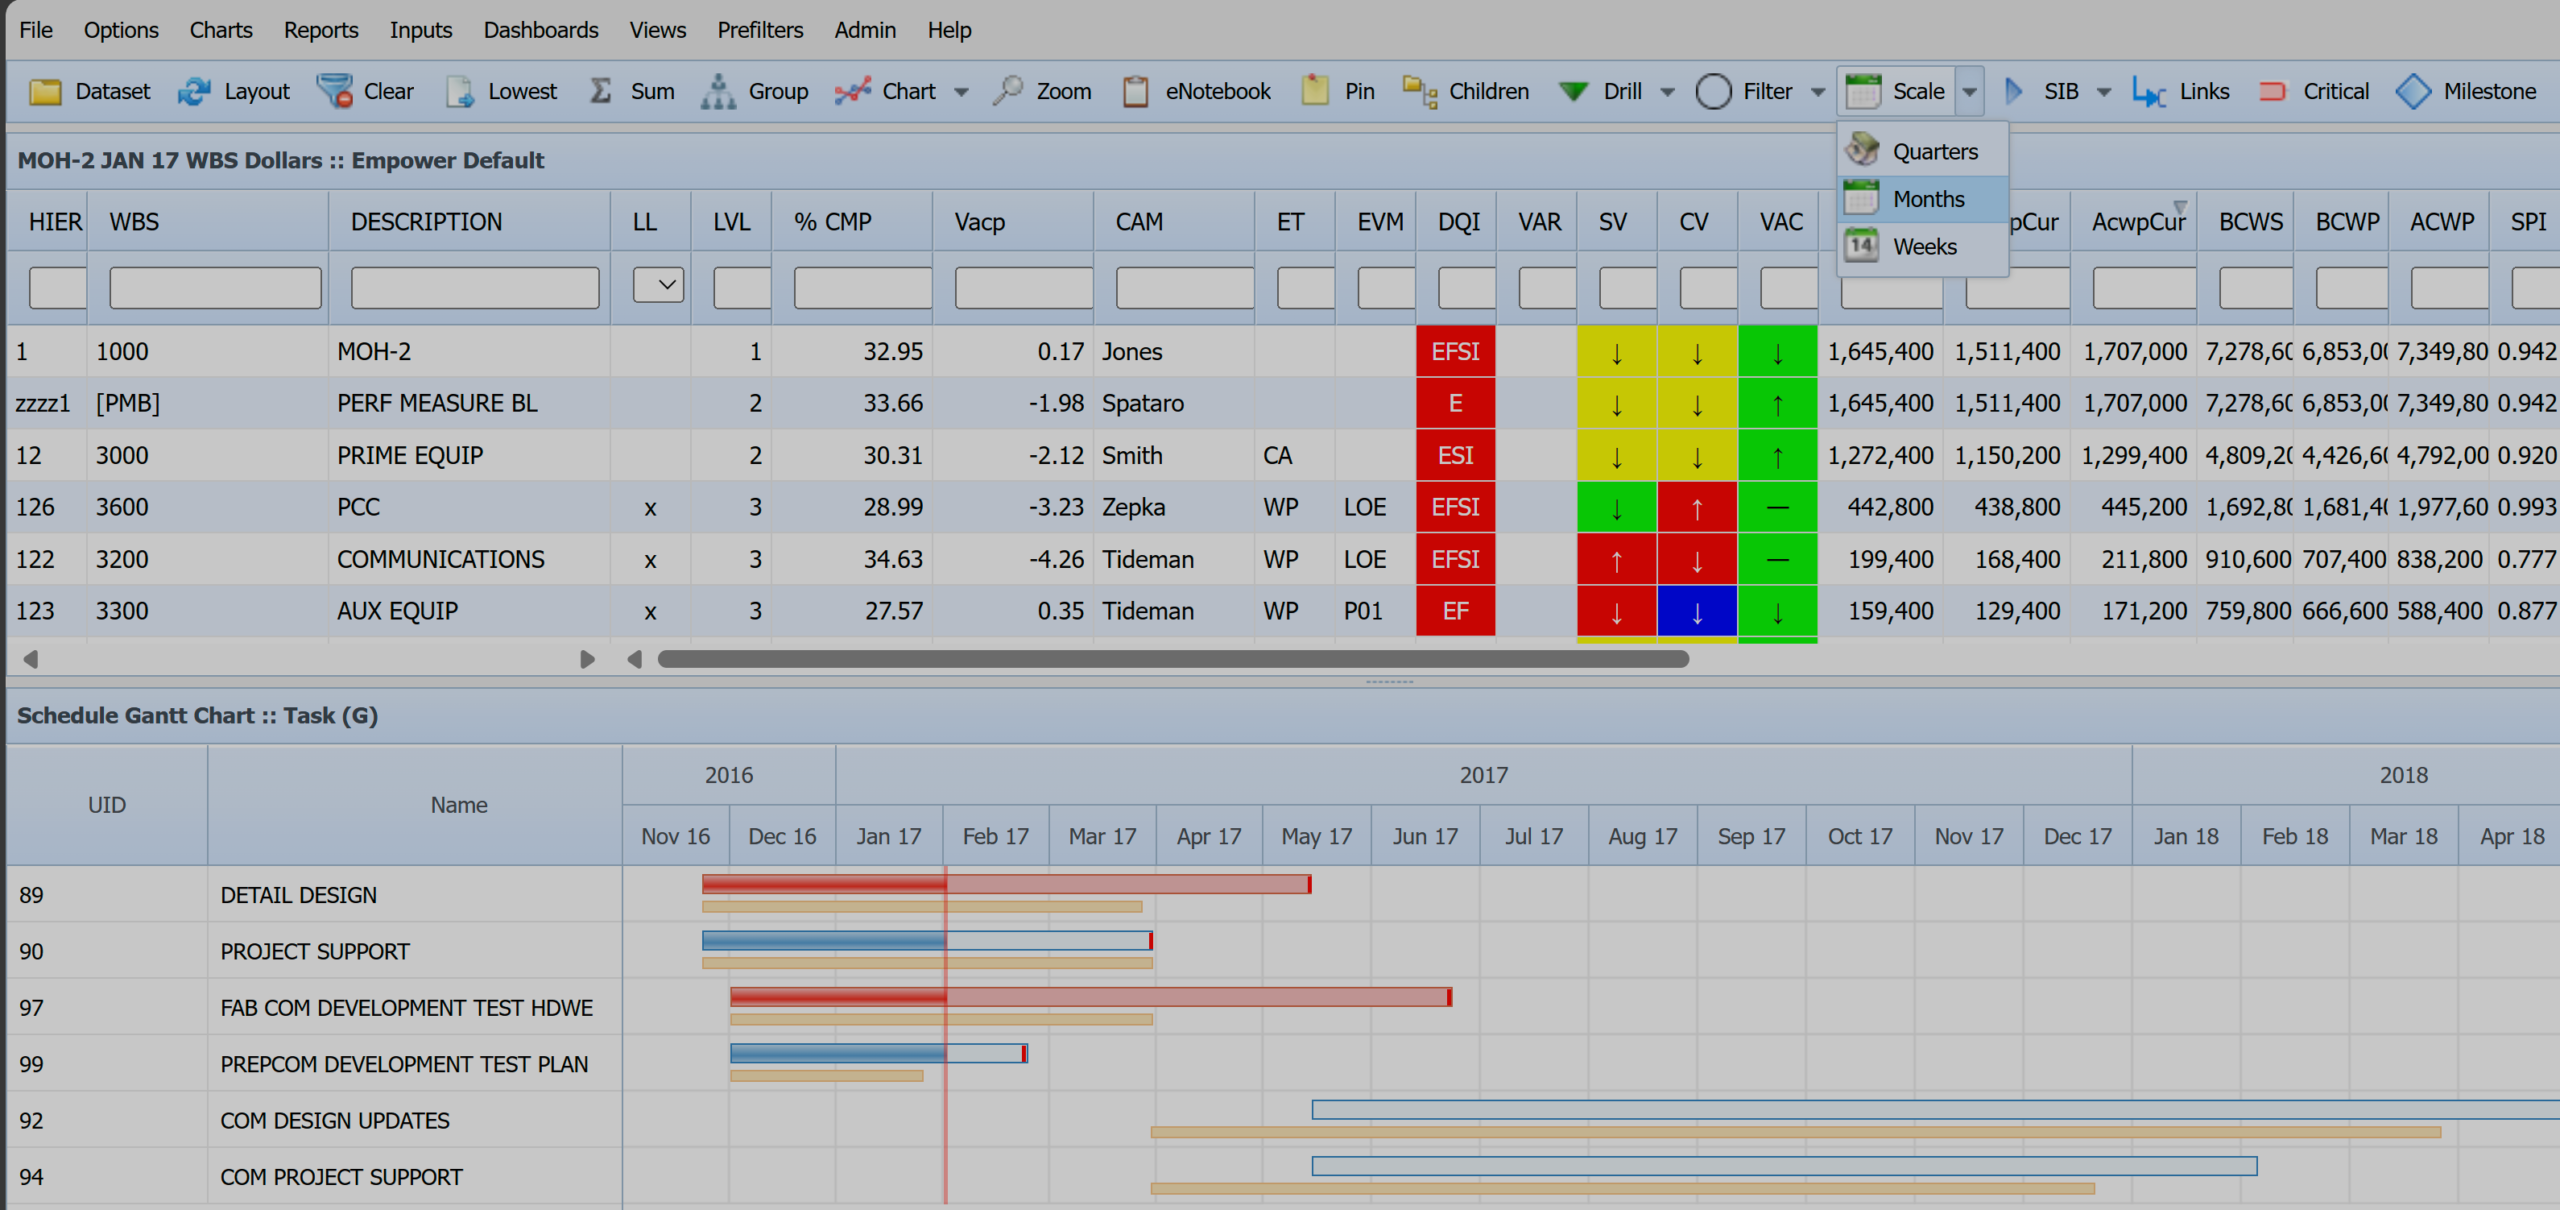
Gantt Drop Down Menu – Months
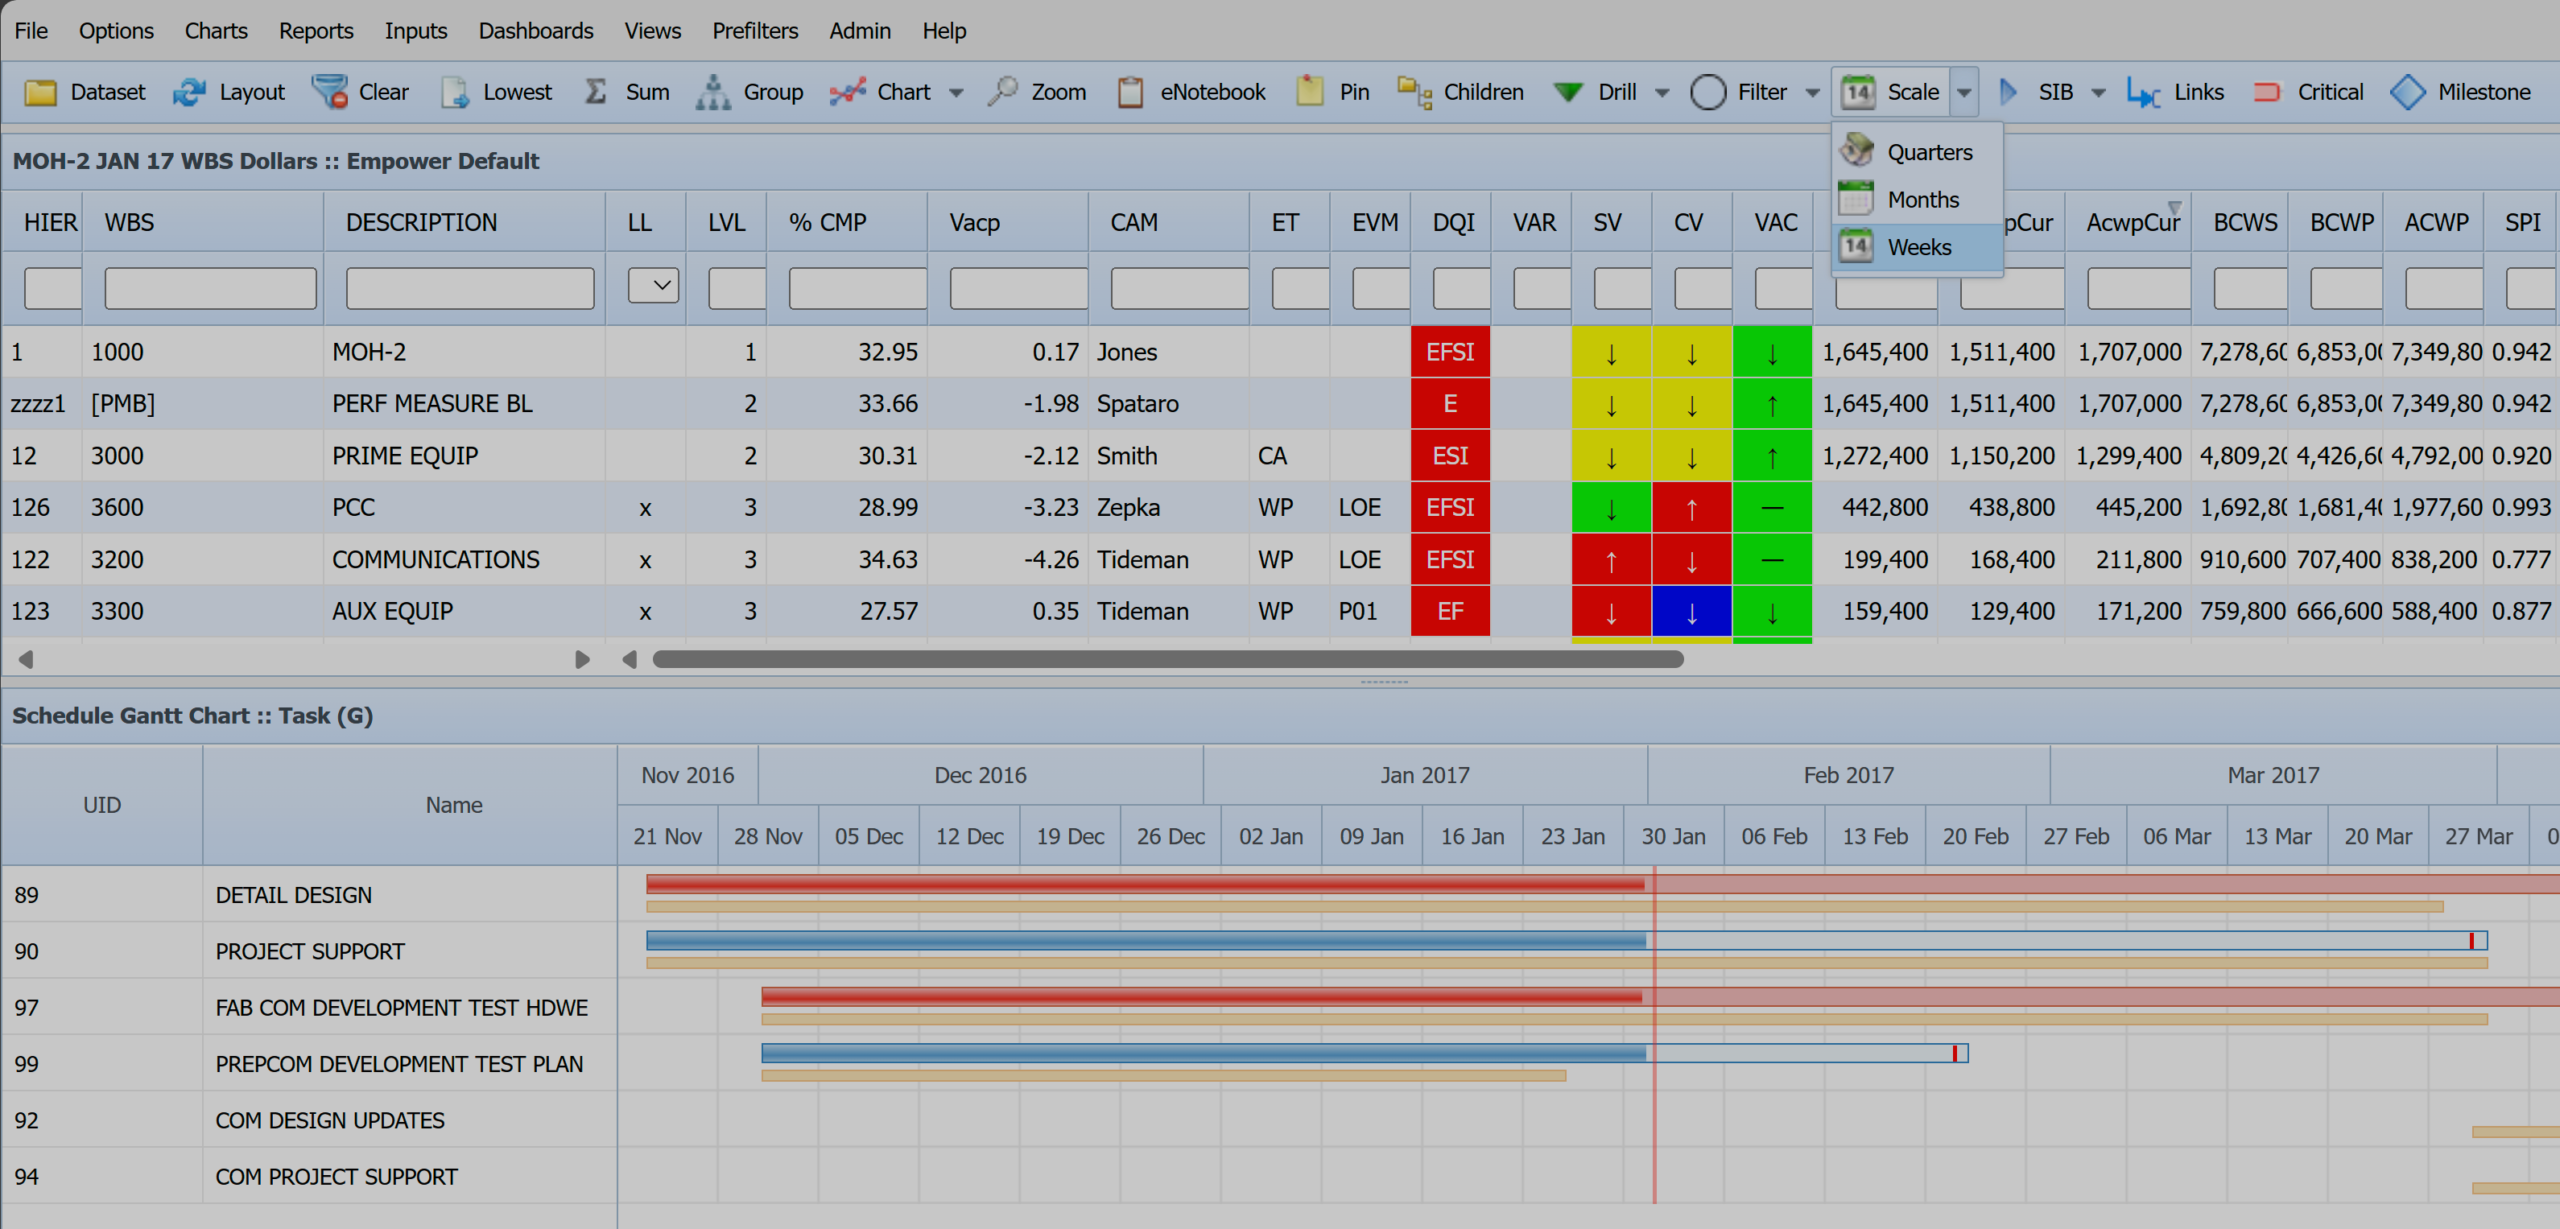
Gantt Drop Down Menu – Weeks
Gantt Mode Button
The Gantt Mode button changes the mode used for determining which tasks are displayed in the Gantt Chart. The options available will depend on whether you are using this option in cost mode or task mode.
The options available will depend on whether you are using this option in cost mode or task mode.
- Note: If Gantt is displayed and NOT in Task Mode, only Relationships and Siblings are the available options.
- Note: The Status Bar will show a 3-letter abbreviation identifying what display options are being used:
- REL = Relationships
- SIB = Siblings
- TRB = Trace Back
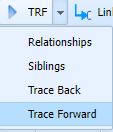
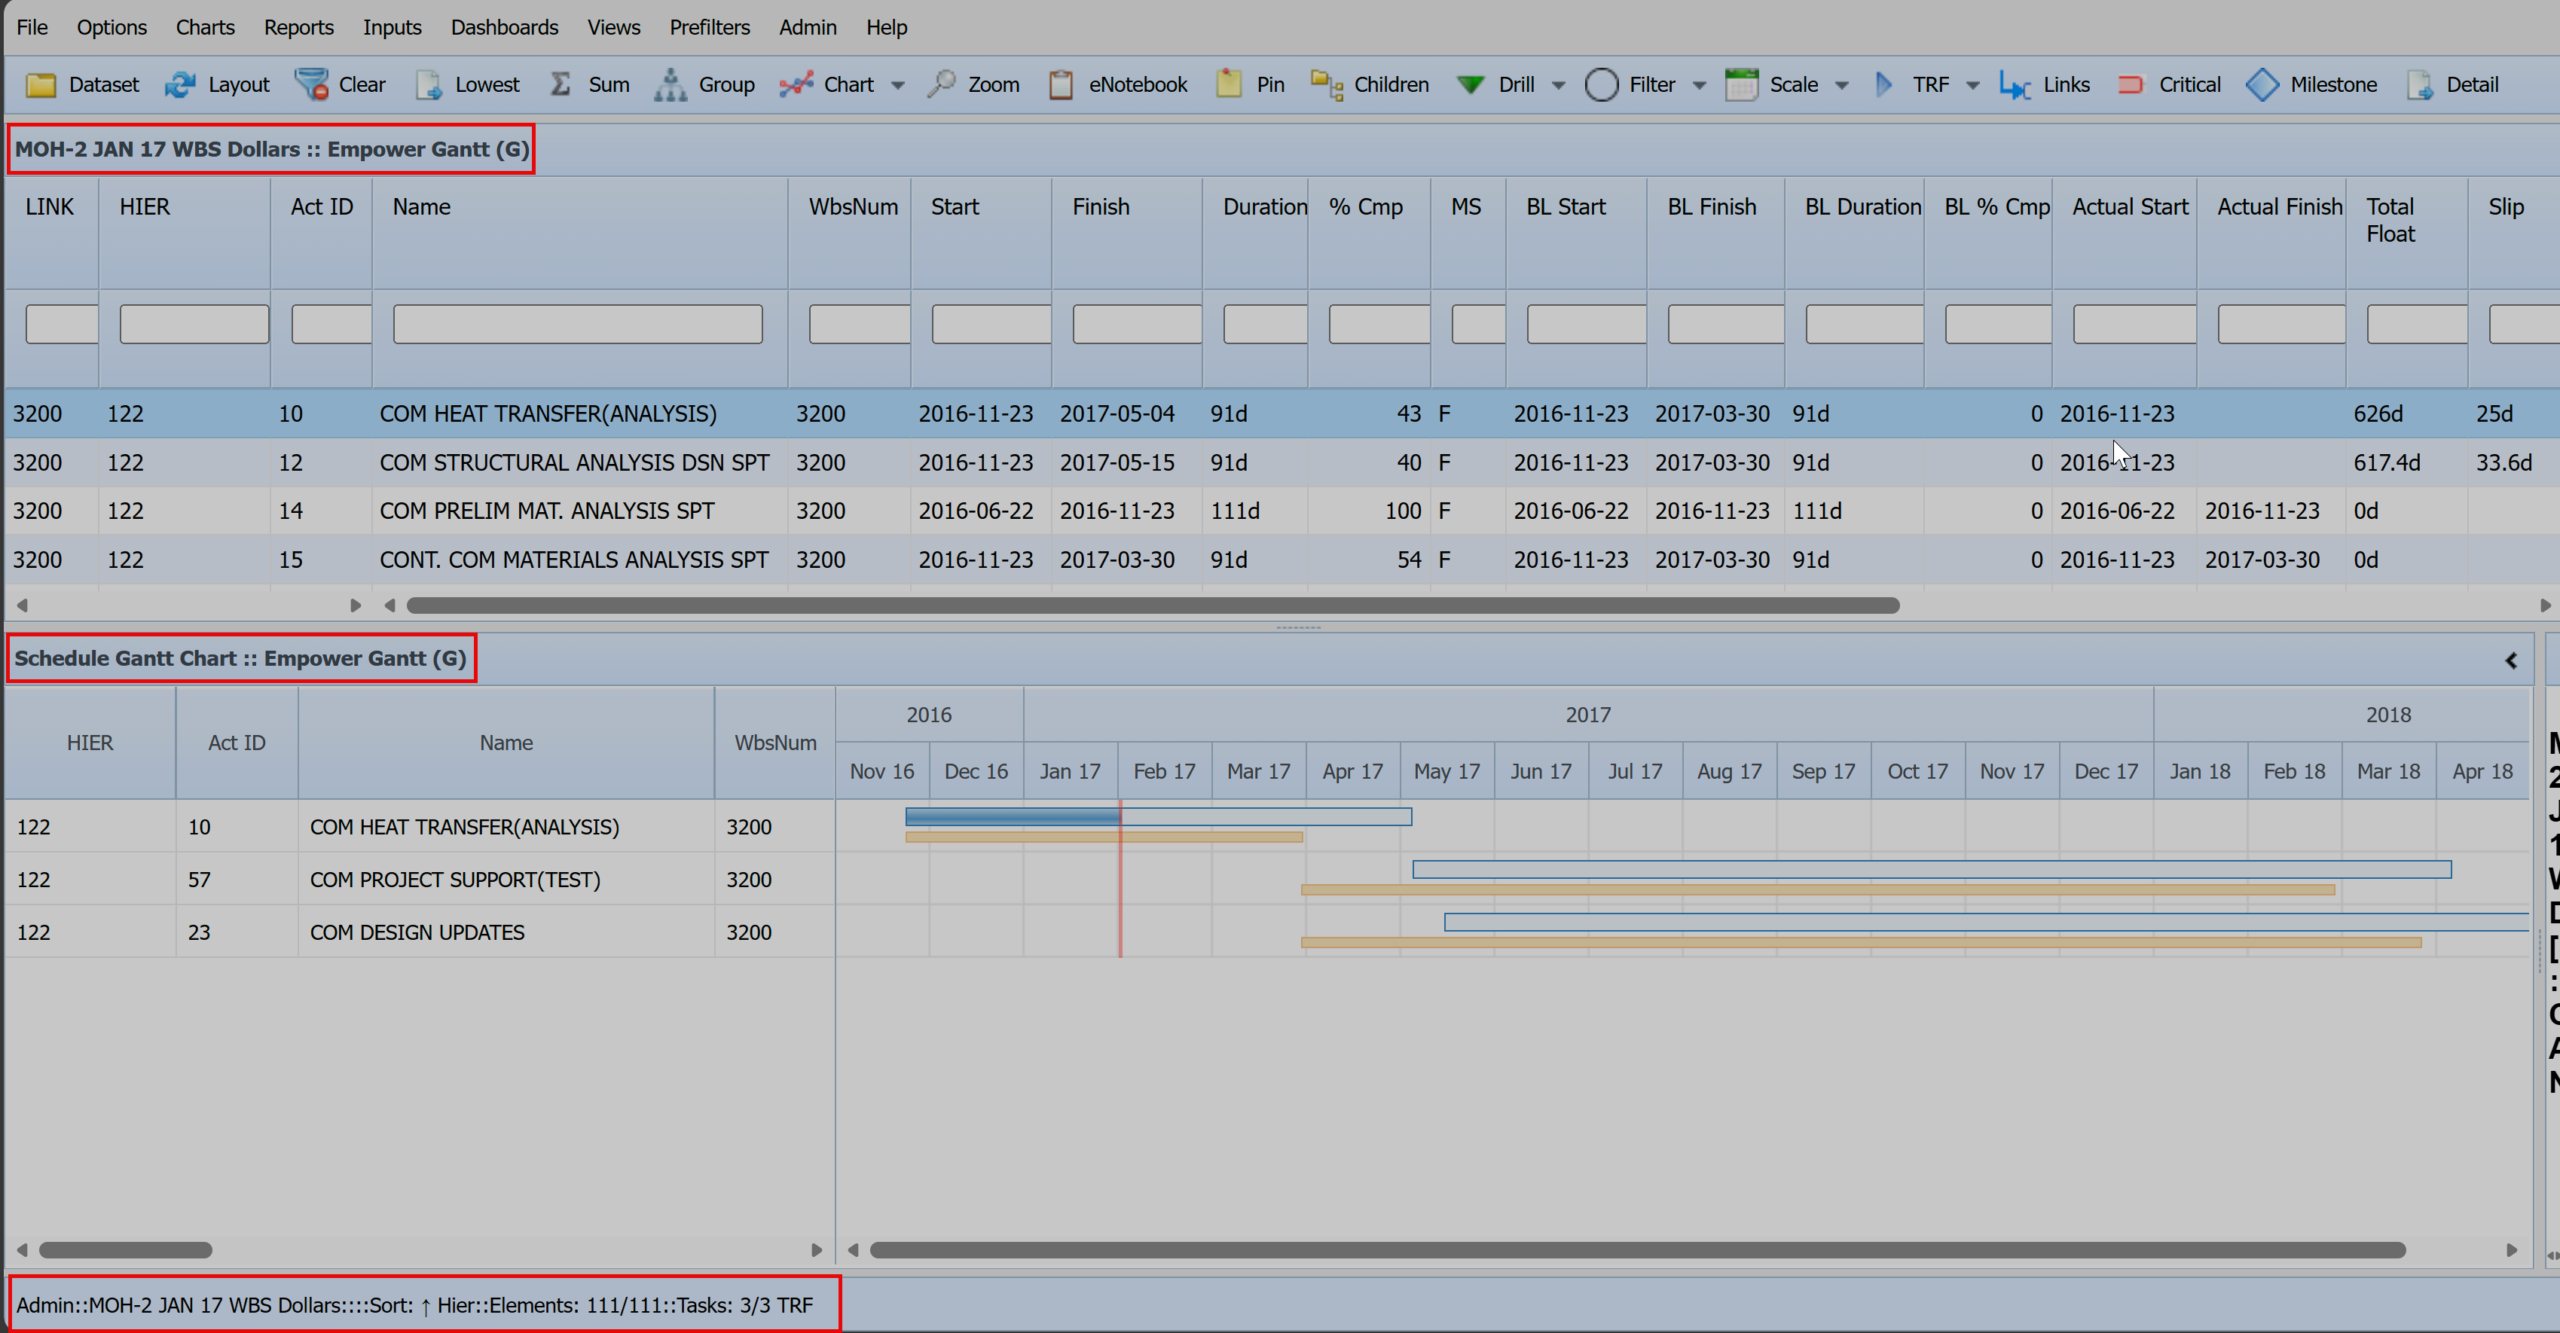
- TRF = Trace Forward
Gantt Cost Mode
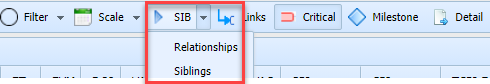
Gantt Cost Mode – SIB
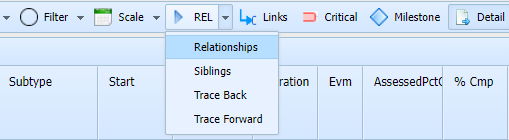
Select Relationships
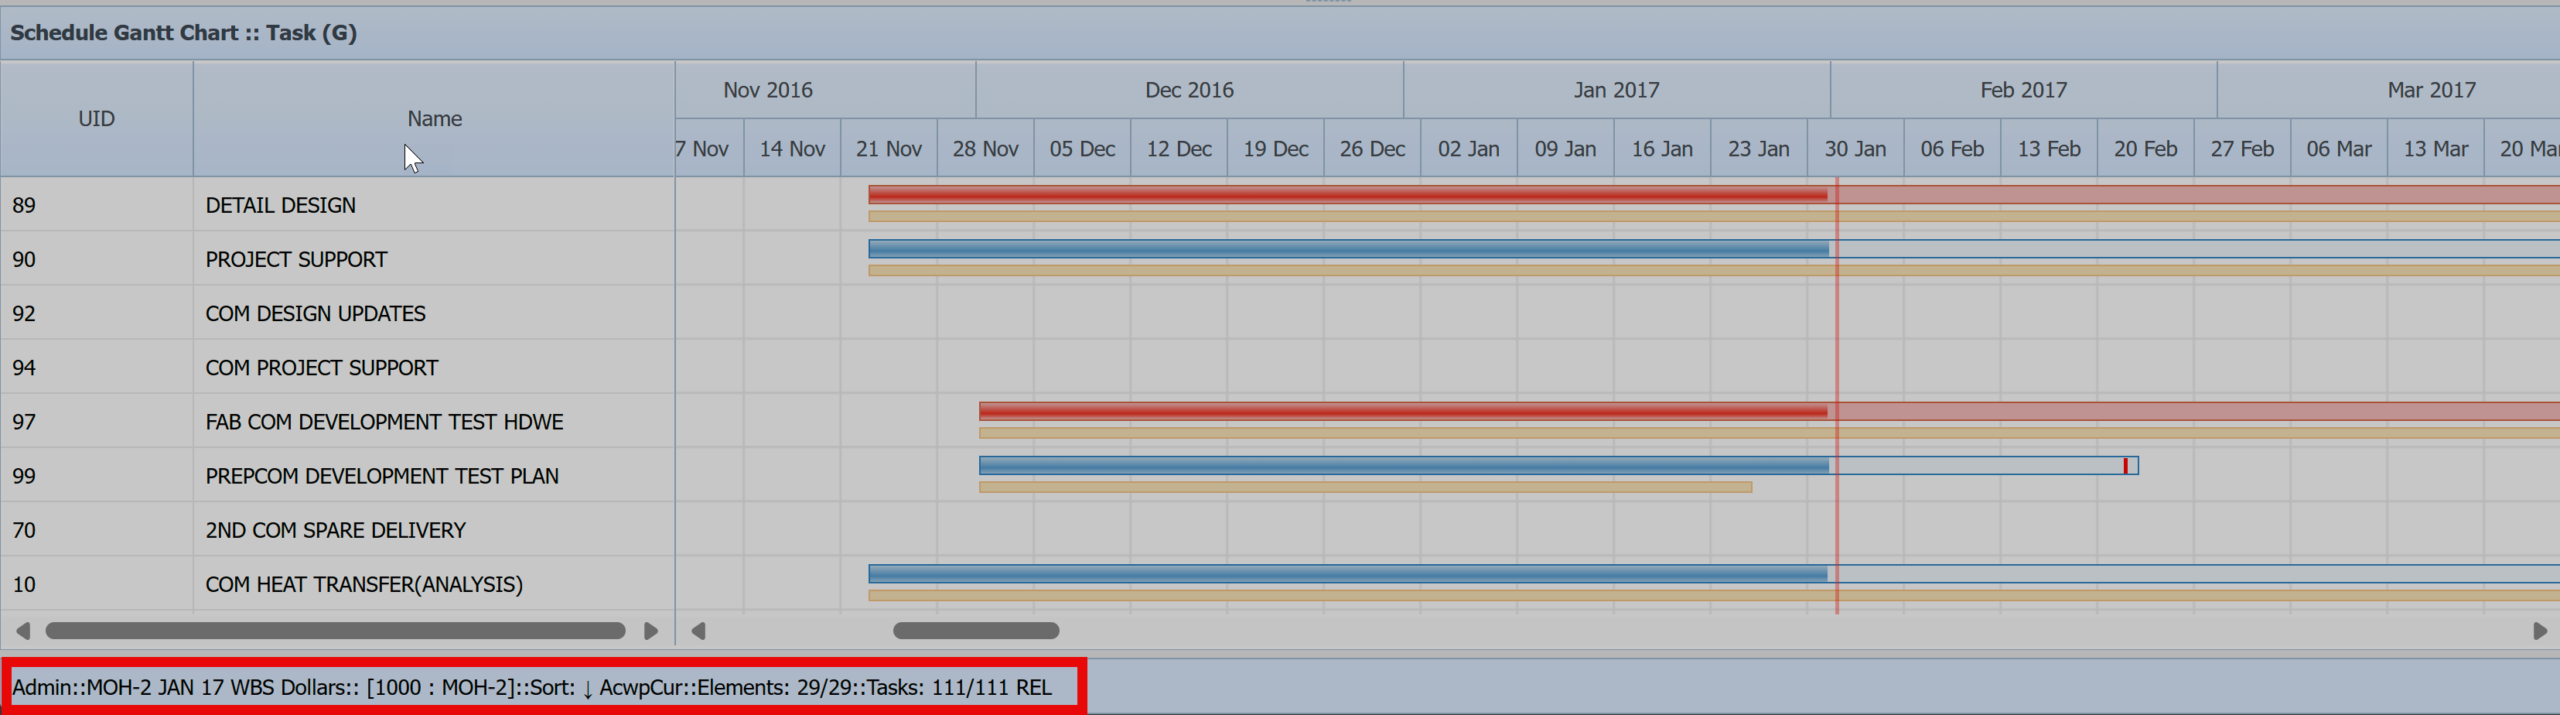
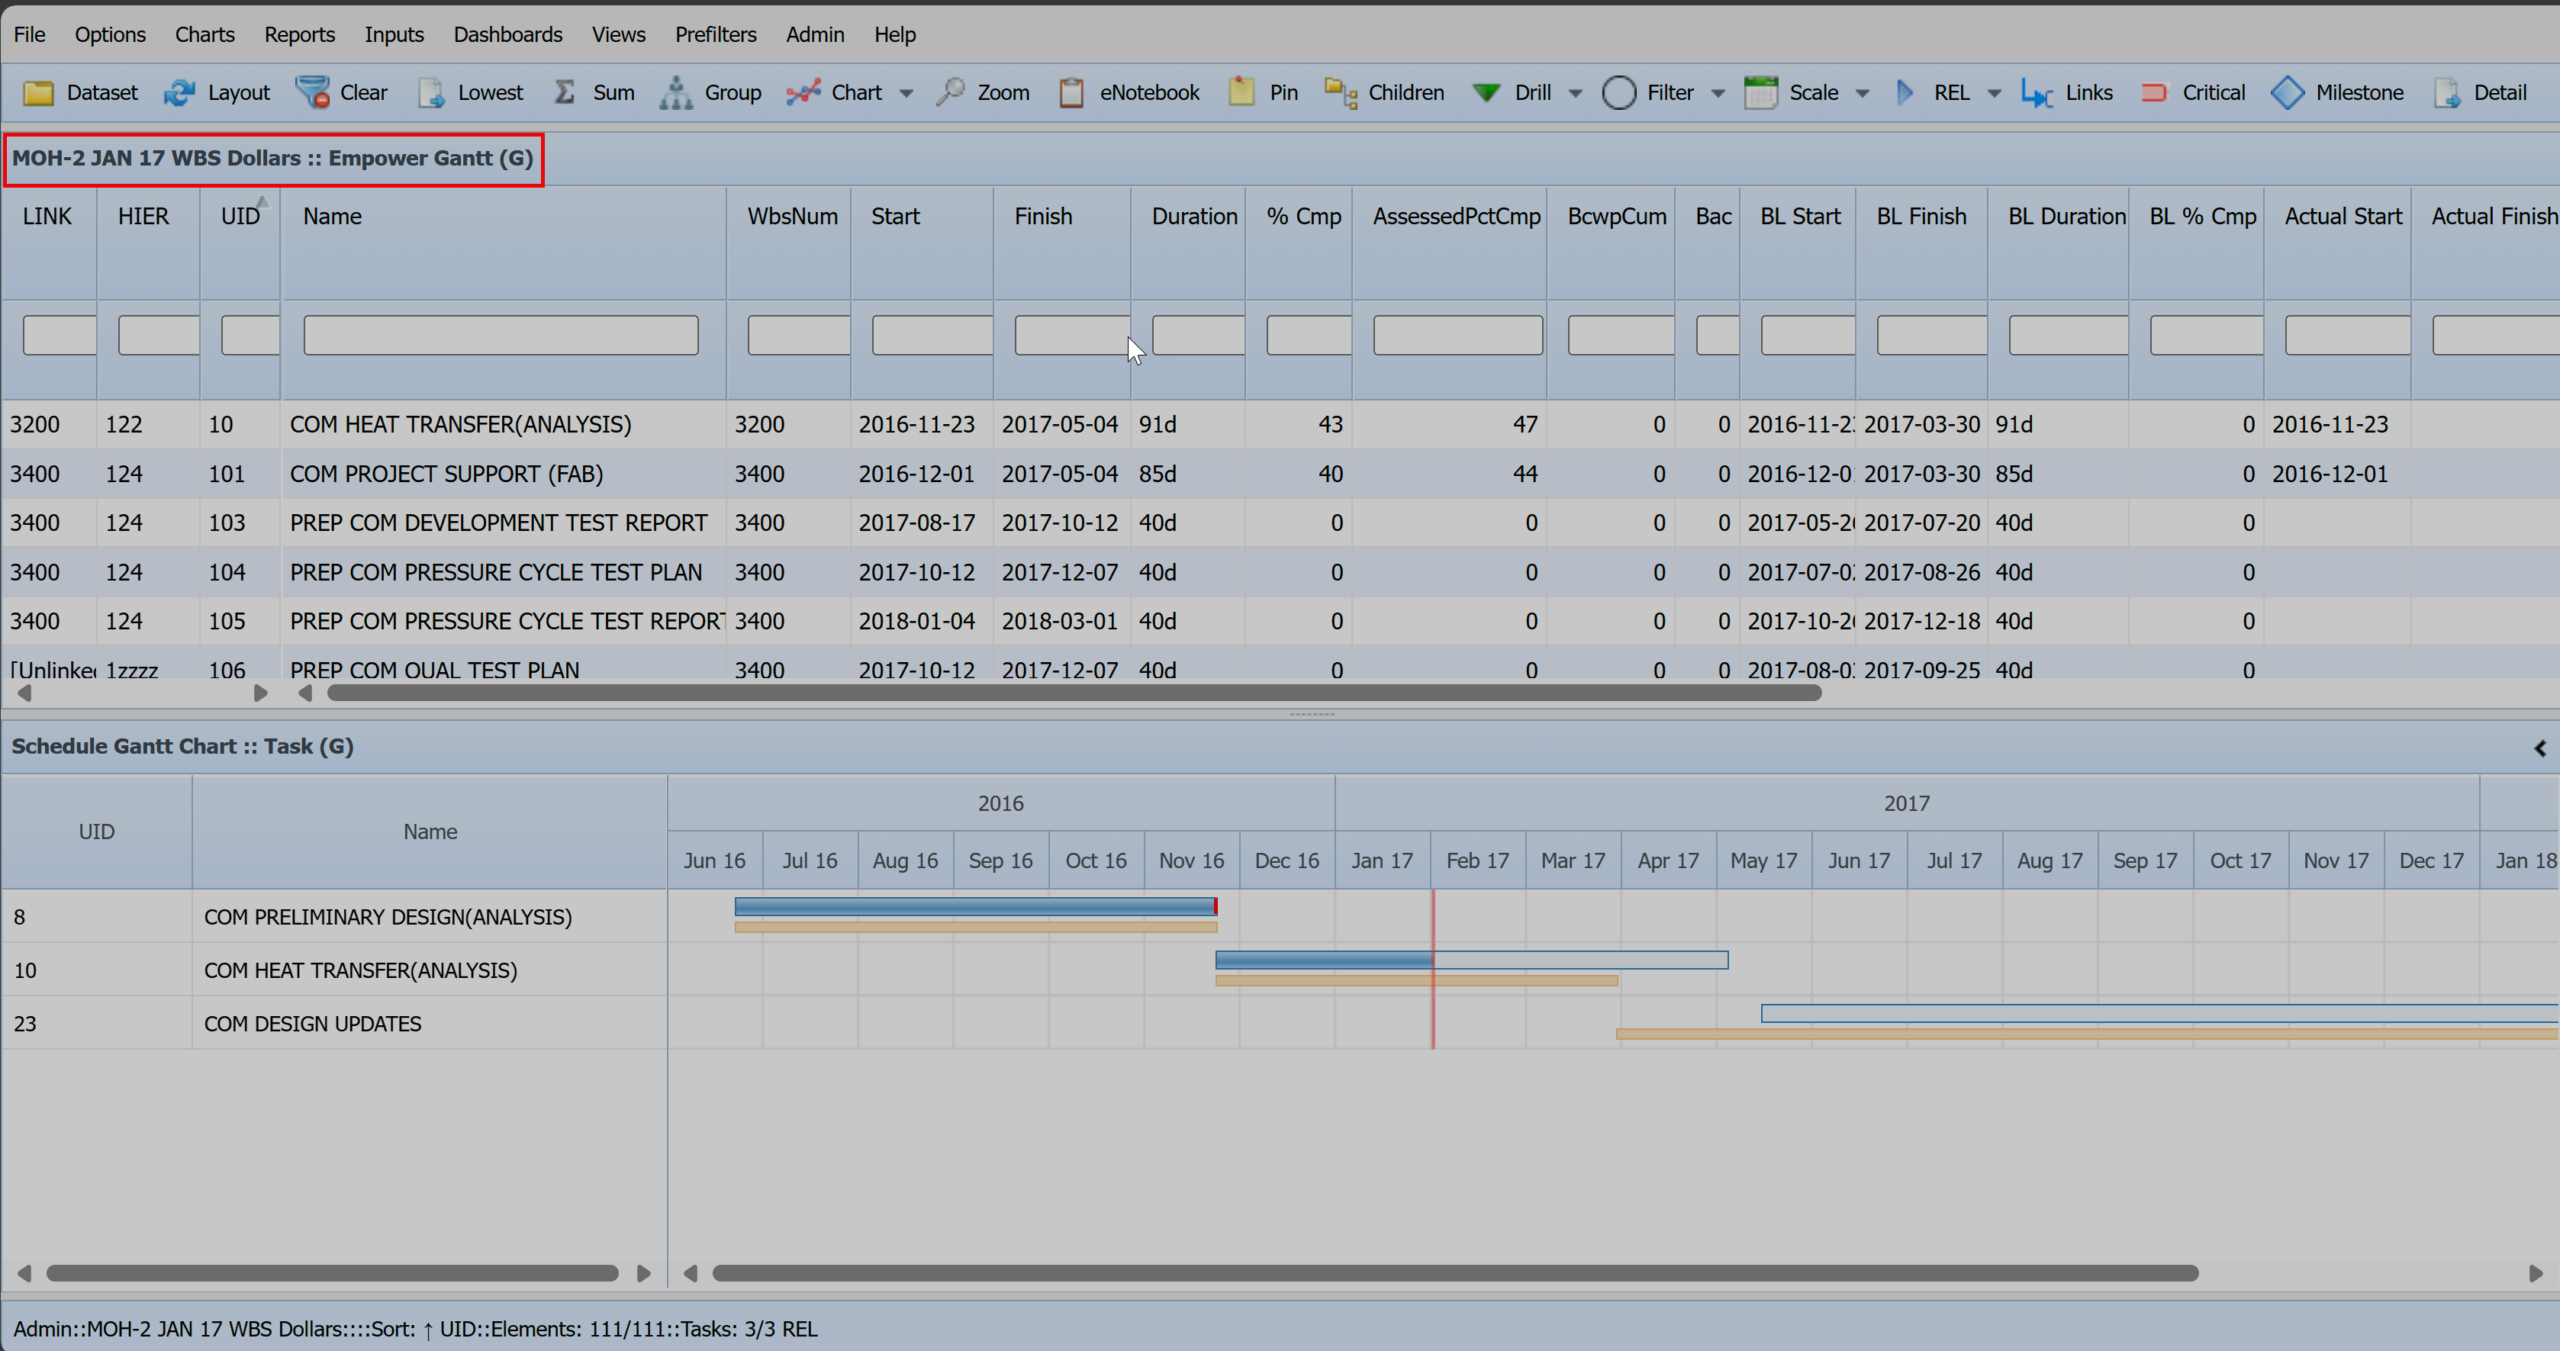
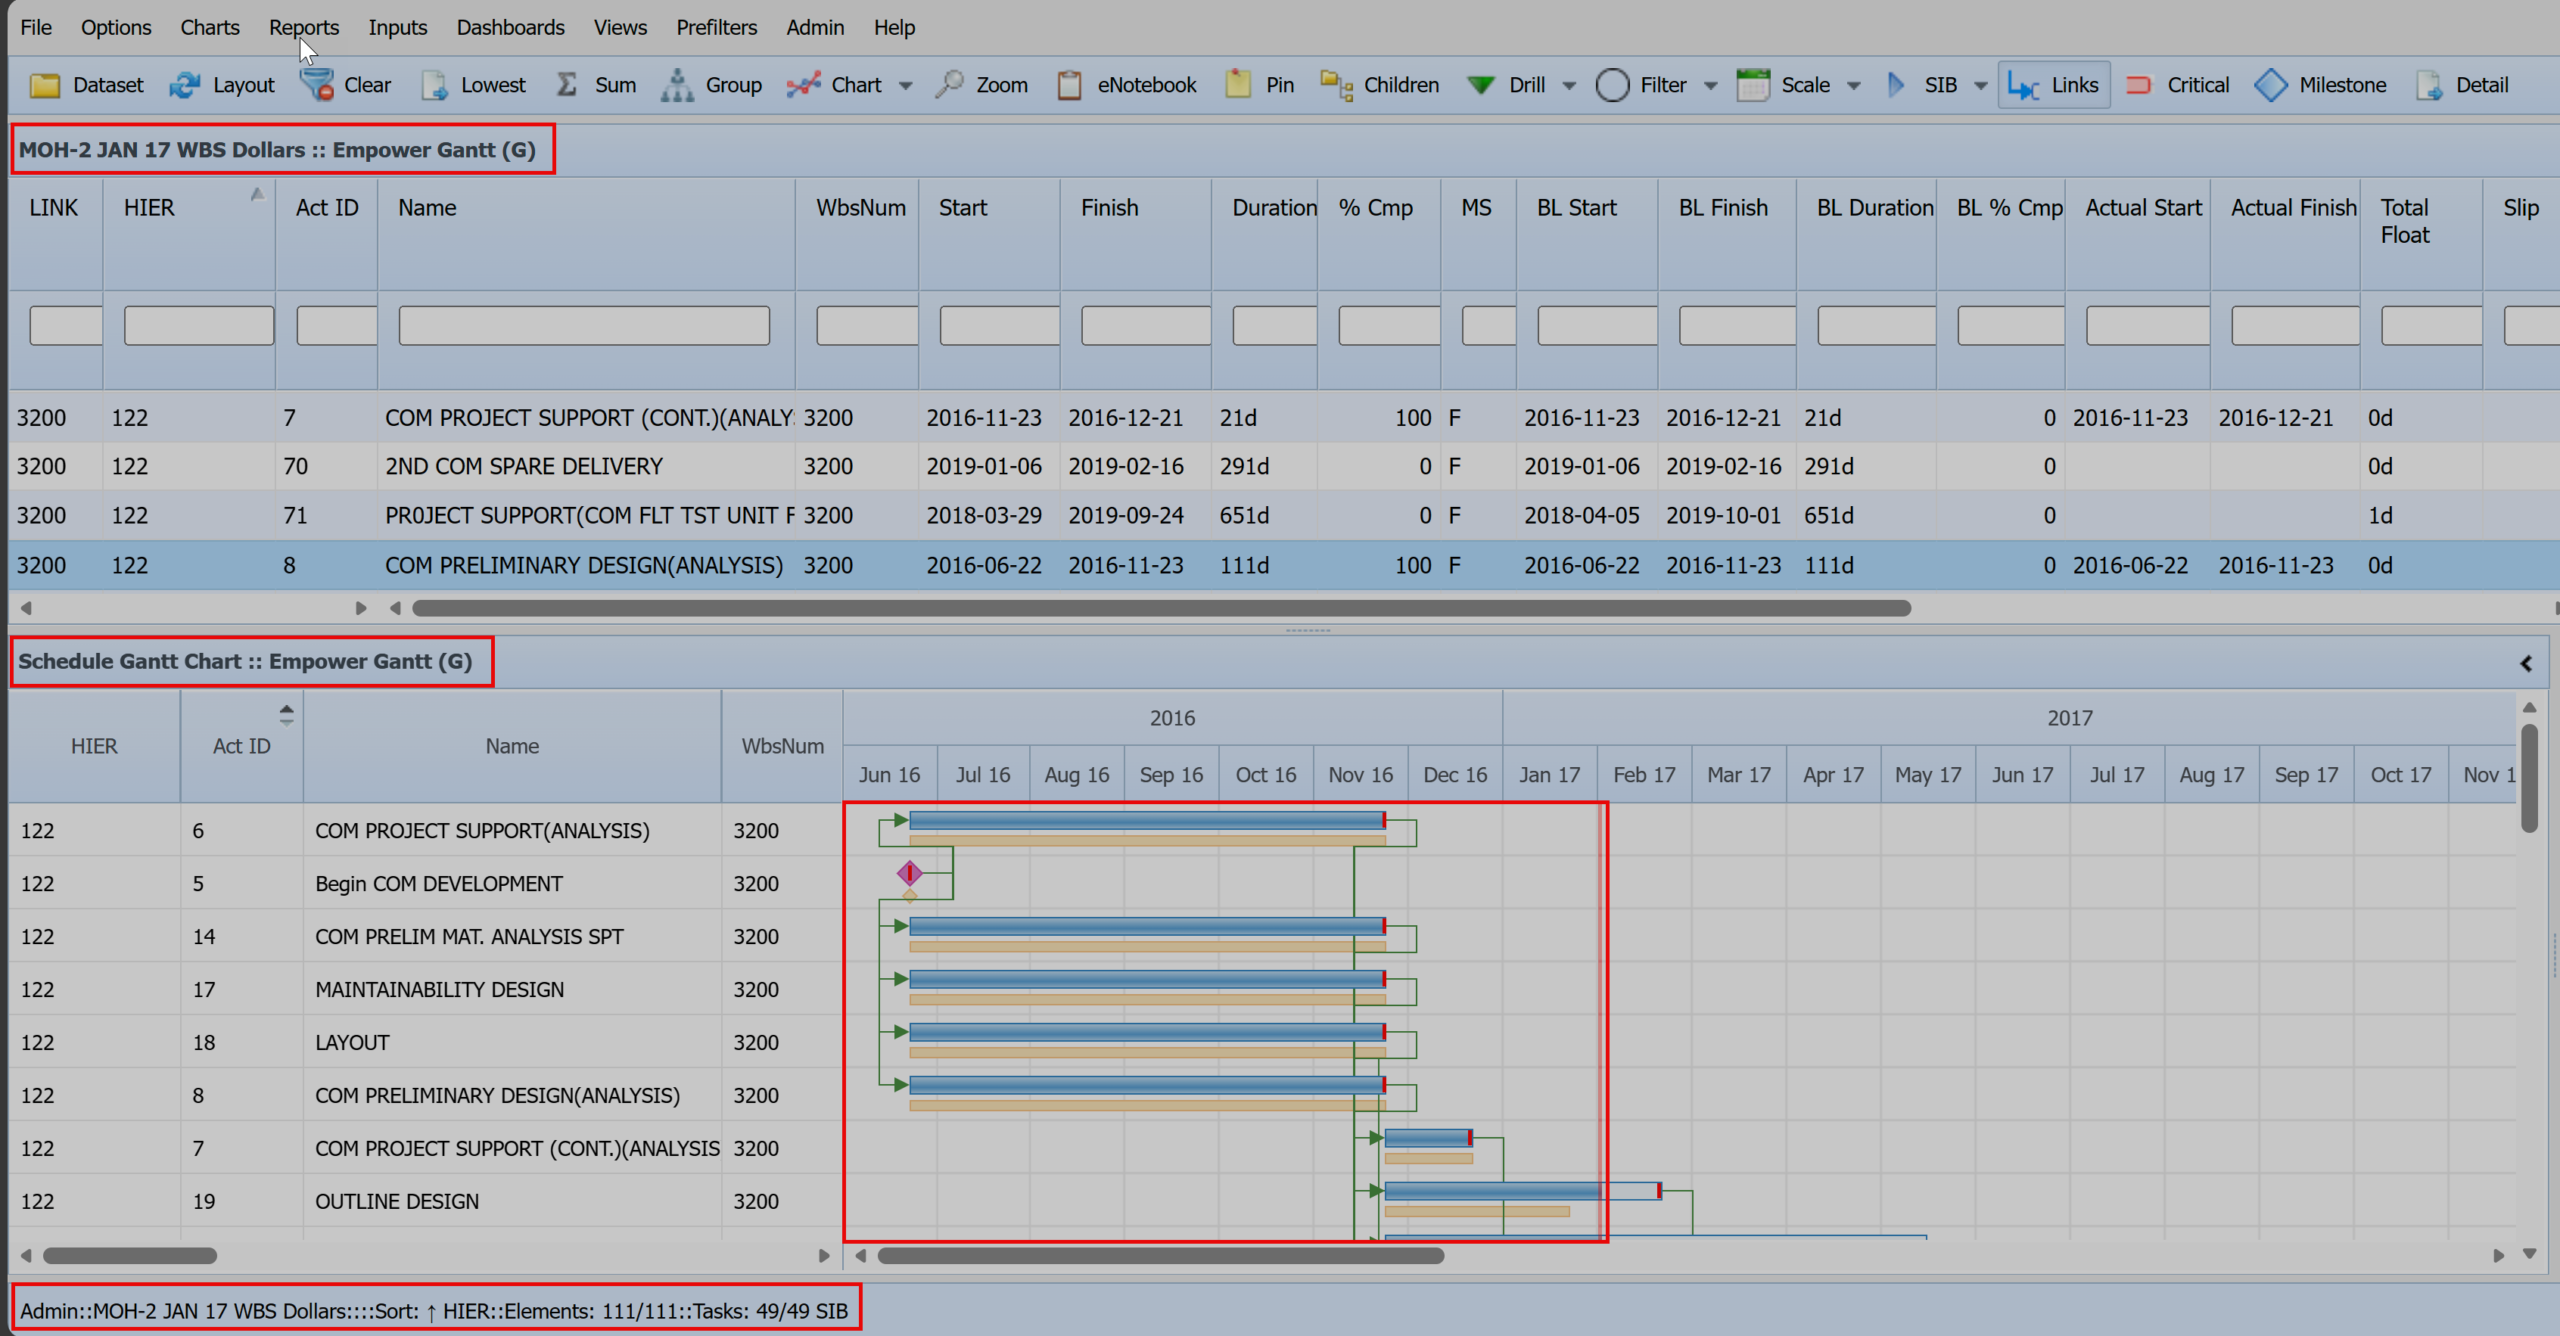
Relationships: In “Cost Mode” display tasks linked to the selected element along with their predecessors and successors. A total of 111 Relationships – WBS 1000: MOH-2
Select Siblings
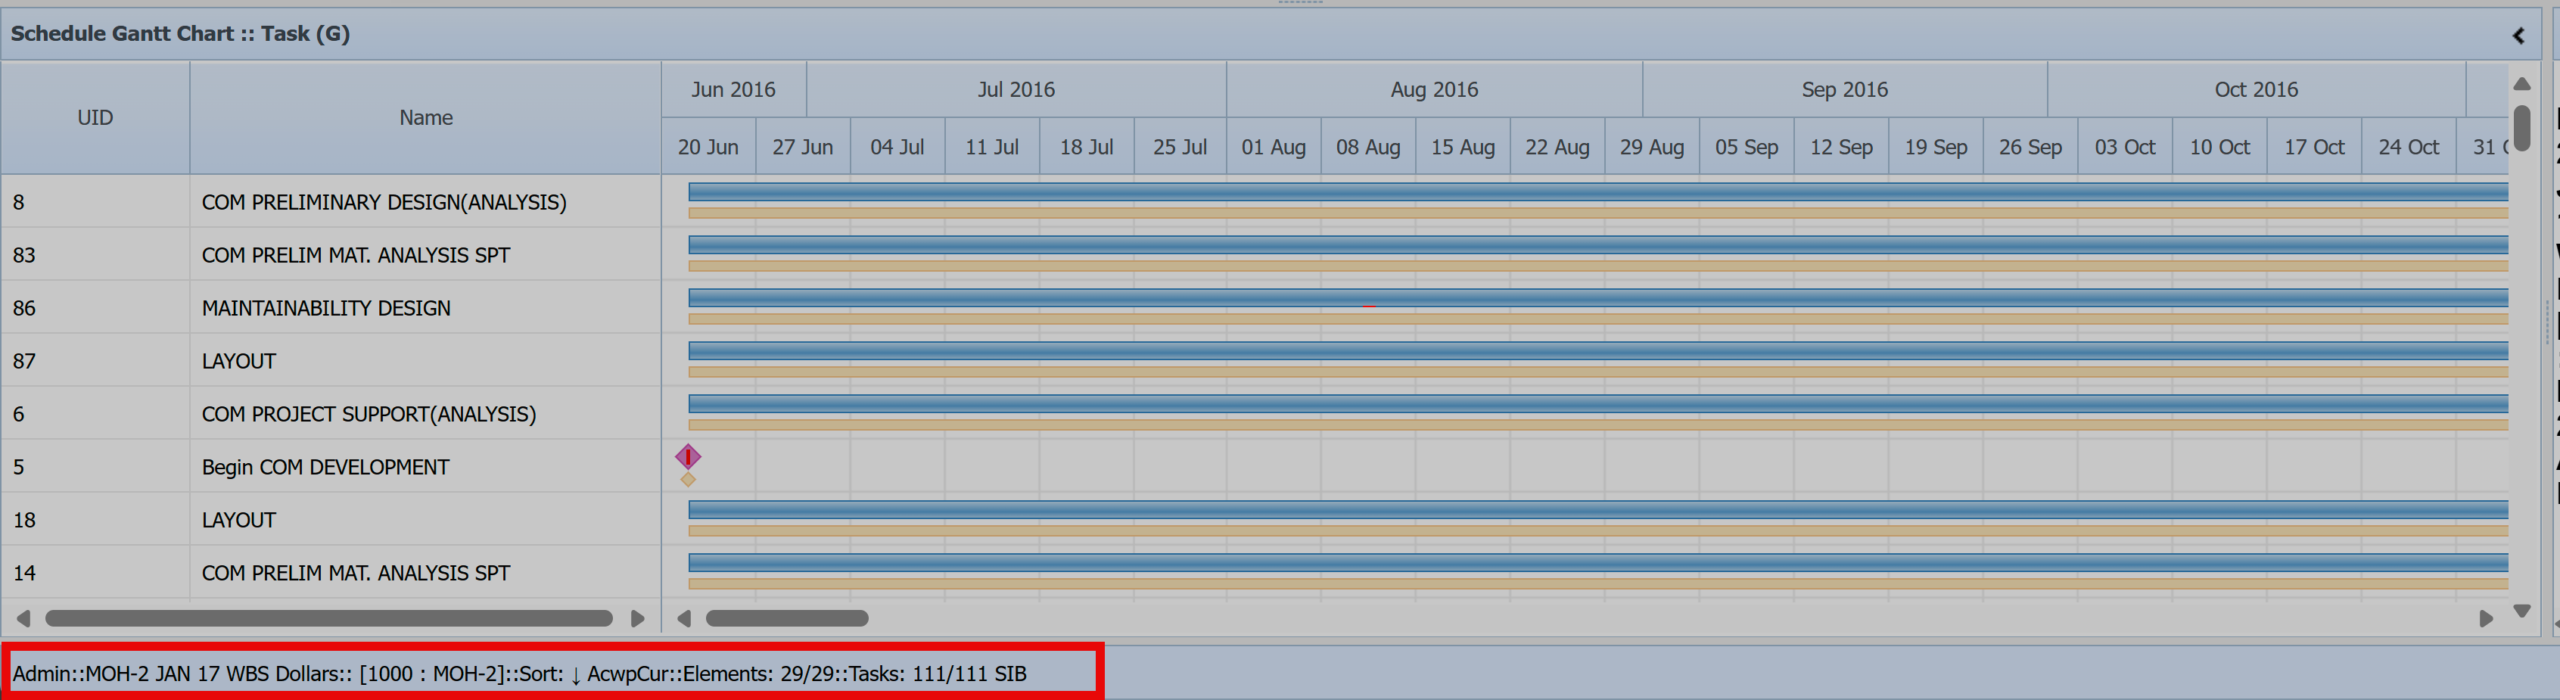
Siblings: In “Cost Mode” display tasks linked to the selected element. A total of 111 Siblings – WBS 1000: MOH-2
Gantt Task Mode
In this section, we will use the term “Task Mode” to refer to “Gantt Views” that are opened in the Sort Window. A Gantt View to open in a Sort Window, you must select the Shift Key when selecting the desired Gantt View for schedule analysis. rows in the sort window no longer correspond to elements, instead each row is a task. Using Task Mode allows the use of interactive filters on schedule fields.
- Relationships: In “Task Mode” display all immediate predecessors and successors of the selected task .
- Siblings: In “Task Mode” display all tasks in the same work package based on WP value.
Enabled when in Task Mode:
- Trace Back: Select task and observe sequence of task(s) that must be completed prior to the selected task.
- Trace Forward: Select task and observe the sequence of task(s) that will be impacted if the task slips.
Gantt Task Mode Enabled
The status bar will indicate which selection is active:
1. Select Shift Key and hold > Select Empower Default [Gantt] view:
![Empower Views - Global = Empower Default [Gantt]](https://smawins.com/wp-content/uploads/2025/12/Empower-Views-Global-Empower-Default-Gantt.png)
2. Select Task in Gantt Task View

3. Select Trace Back

4. Select Trace Forward
Gantt Links Button
The Gantt Links button turns on or off the display of logical connections between activities. Note that the relationships between tasks will not display unless both tasks are shown in the view. Note that the yellow bar represents the baseline, the blue bar the current plan for non-critical tasks, the red bar the current plan for critical tasks, and the shaded center of the blue/red bars shows progress. Task relationships can be toggled on or off via the Gantt Toolbar Links button. Relationships are not displayed unless both activities are visible in the chart.
![]()
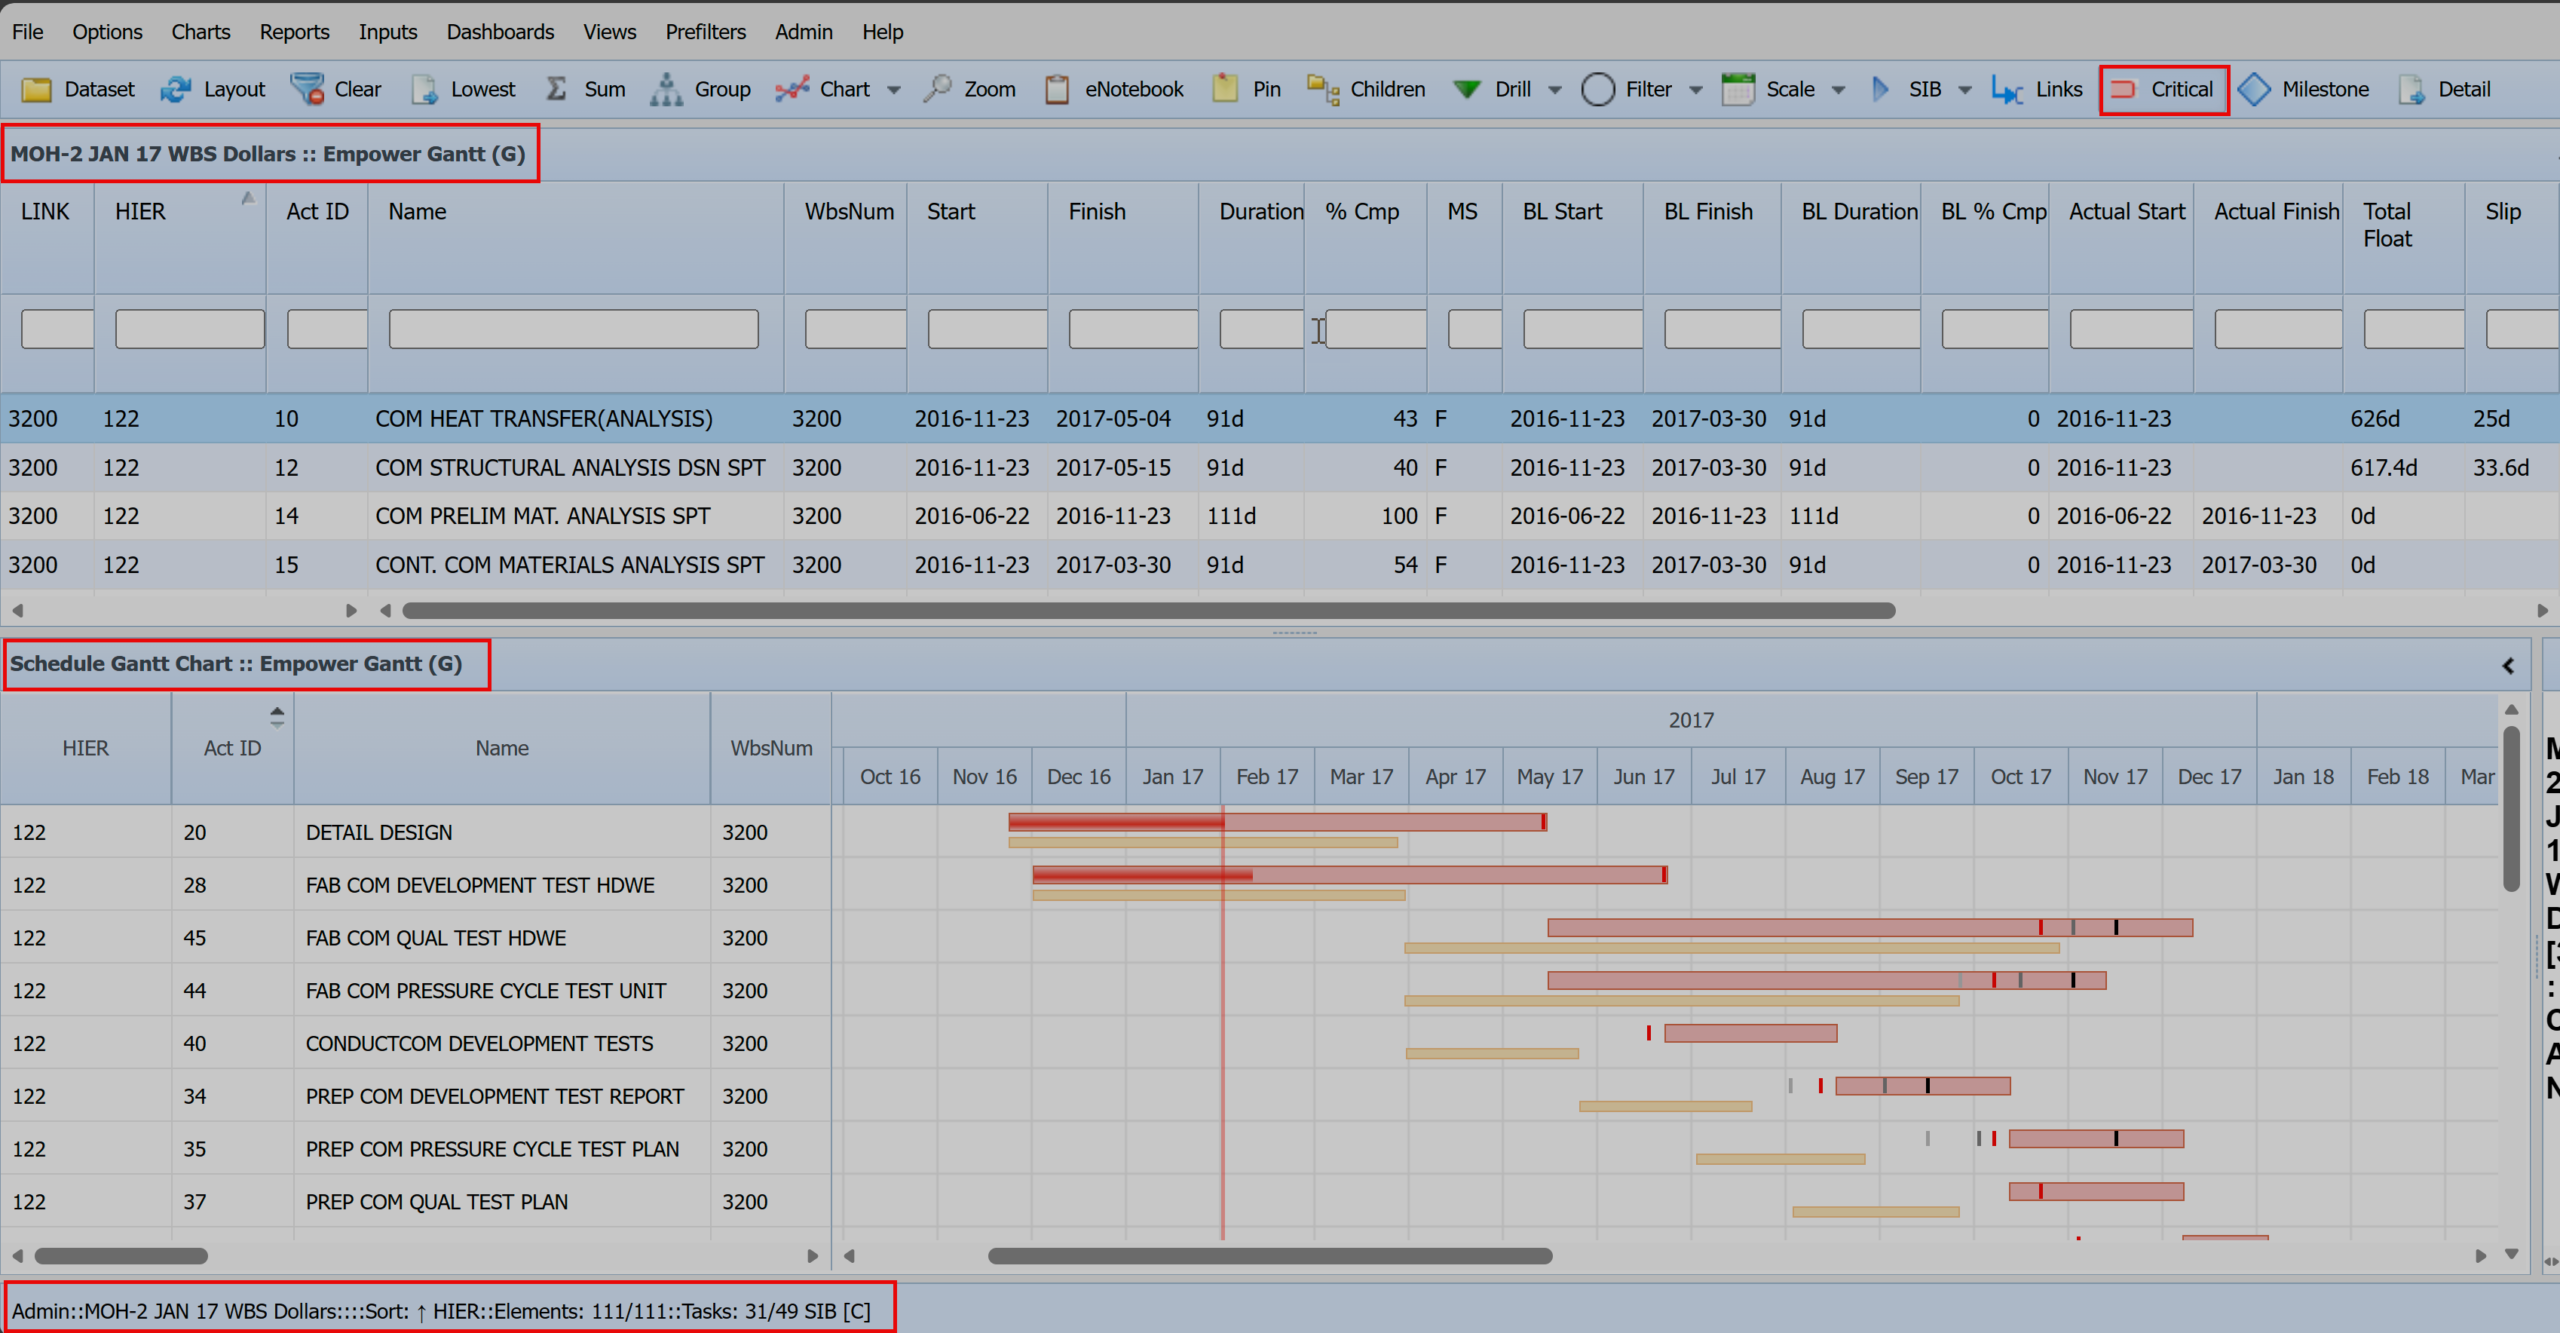
Gantt Critical Task Filter
Selecting the Gantt Critical button will filter the Gantt chart to tasks for which the “Critical” flag is set to “T”. The status bar will change to reflect this selection of critical tasks.
![]()
Selecting the Critical button limits the number of tasks shown, and the status bar, shown below, reflects this. Only 31 of the 49 tasks are marked “Critical” (“31/49”), and the “[C]” indicates that the Critical button has been toggled on. (The button’s background will also change appearance depending on your browser when it is toggled on.
Gantt Milestone Filter
Selecting the Gantt Milestone button will filter the Gantt chart to show just milestones . The status bar will change to reflect this selection of milestone tasks.
![]()
Gantt Detail Filter
Selecting the Gantt Detail button will filter the Gantt chart so that it does not show summary level tasks. The status bar will change to reflect this selection of detail tasks.
![]()
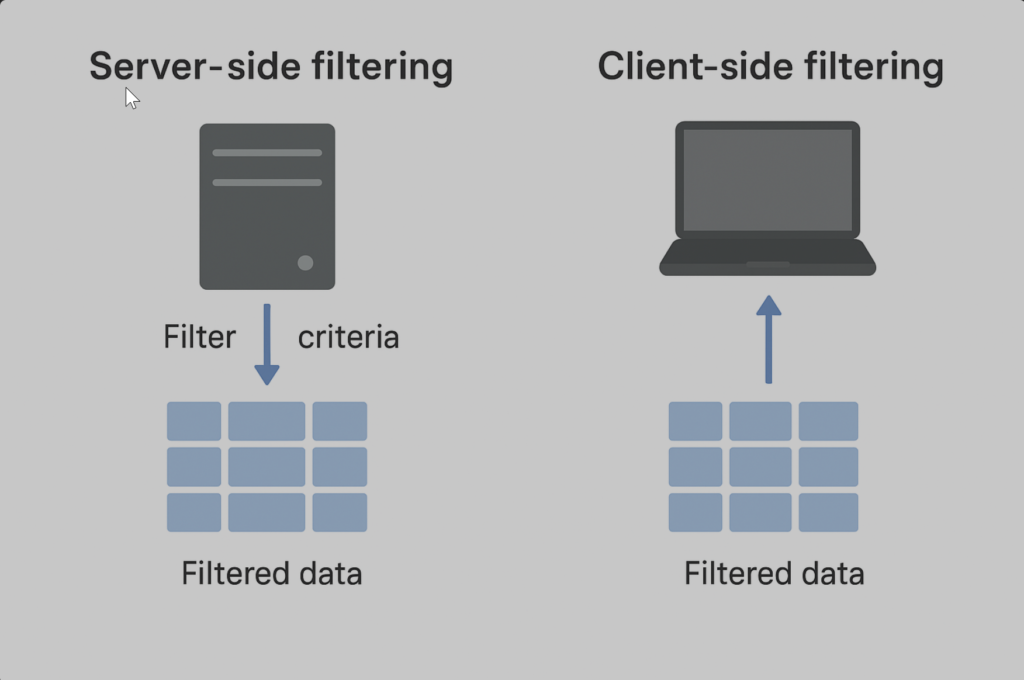
Filtering Data with Global Pre-Filters
Pre-Filters are executed on the Empower server and limit which rows of data are transmitted to the user’s computer. Records that do not meet the Pre-Filter criteria are never loaded and therefore cannot be analyzed or further filtered interactively.
Key Characteristics of Pre-Filters:
- Executed on the server prior to data transmission.
- Reduce the volume of data sent to the user.
- Improve performance by limiting unnecessary data.
- Determine the universe of records available for subsequent interactive filtering.
Example:
A project contains 1,000 WBS elements. A Pre-Filter is applied where CAM = Smith. The server identifies that Smith owns 200 WBS elements. Only those 200 rows are sent to the user, and therefore:
- The user can only interactively filter within those 200 rows.
- The remaining 800 WBS elements never reach the client machine.
Sort vs. Gantt Pre-Filters
Empower maintains separate filtering systems for:
- Sort Views (tabular/data-centric)
- Gantt Views (time-phased/schedule-centric)
The differences in Pre-Filters correspond directly to the differences between Sort and Gantt views themselves. Each view type uses its own Pre-Filter configuration to ensure filtering logic aligns with the structure and purpose of the view.
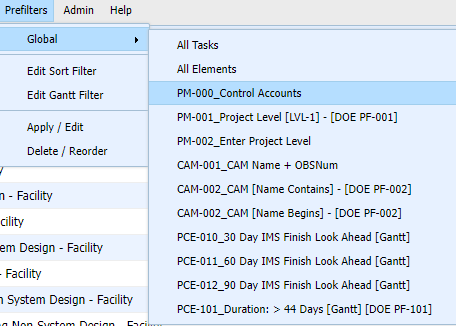
Global Pre-Filters
Empower supports the creation of Global Pre-Filters, which are made available to all users across the Empower environment. These are typically configured by the Empower Administrator. Administrators can:
- Create standardized Pre-Filters for common reporting, analysis, or CAM-based data segmentation needs.
- Ensure consistency across the Empower user community.
- Improve performance and streamline common workflows.
Common Global Pre-Filters
A list of common and customized global pre-filters which are distributed to the Empower User Community via Global Pre-Filters:
| PREFILTER NAME | CONDITION | DESCRIPTION |
|---|---|---|
| Control Accounts | ElemType = ‘CA’ | Filters for Element Type = CA – Control Accounts |
| 60 Day IMS Finish Look Ahead [Gantt] | StatusDate < Finish AND Finish <= Status60 | Activities finishing in the next 60 days from the Status Date |
| Project Level | ElemLevel=1 | Filters Level 1 or Top Level in Project Only |
| CAM-001 | [Name Contains] | Filters CAM Name that contains either First Name or Last Name. Dependent on CAM Naming Convention. |
| CAM-002 | [Name Begins] | Filters CAM Name that begins with either First Name or Last Name. Dependent on CAM Naming Convention. |
| 60 Day IMS Finish Look Ahead [Gantt] | StatusDate < Finish AND Finish <= Status60 | Activities finishing in the next 60 days from the Status Date |
| No LOE | Evm not like LOE | Evm not like ‘LOE’ |
| CPI < TCPI by .05 | (CpiToEac < –.05) AND (PctCmp >= 1 AND PctCmp <= 99) | Cost Performance Index (CPI) < To Complete Performance Index (TCPI) by .05 and Percent Complete >= 1 and Percent Complete <= 99. |
| Description Contains | ElemDesc like ‘(Element Description)%’ | Filters WBS Description (i.e., Design, Facility, Management, System, etc.). |
Summary
Empower provides tools to identify problem areas, recognize trends, display cost information, graph schedule Gantt charts, gain insight into quality issues, and streamline the creation of narratives and corrective actions through integrated workflows. The primary advantage of interactive filters in Empower is that they facilitate real-time data analysis without requiring pre-set filters.
 |
Alan Kristynik, PMP, GWCPM, is a Senior Associate in SMA’s Integrated Program Planning & Controls (IPPC) Practice, and has a Deltek Cobra Master Certification. He has been a Certified Project Management Professional with PMI since 1998, has an active DoD Top Secret clearance, and is a Subject Matter Expert in Earned Value Management Systems (EVMS). |
Posted on December 3, 2025, by
Dick Eassom, CF APMP Fellow, SMA, Inc.


