
SMA Competitive Index
To maximize your experience, interactive SMA Competitive Index data are optimized for a larger monitor.
Login
Register for Access
What if you could see—objectively and credibly—how competitive your company really is in the federal marketplace?
The SMA Competitive Index is the first data-driven benchmark that measures a contractor’s demonstrated ability to win new government business, not just revenue, backlog, or anecdotal win stories. Built on authoritative federal procurement data and refined by our 40+ years of win strategy experience, the Index goes beyond simple win rates to account for the intensity of competition: number of bidders, number of awards, and contract value. The result is a clear, comparative view of which companies are truly gaining competitive ground—and which are falling behind—across specific customers, markets, and arenas of competition.
Now available as an interactive online experience, the SMA Competitive Index lets you explore how your firm stacks up against peers, uncover where competitive gains are really coming from, and spot emerging threats and opportunities before they show up in market share reports. You can see not just who won, but who won the hardest—and why that matters for future positioning. For executives, business development, and capture leaders, this is a forward-looking lens into competitiveness that simply does not exist anywhere else in the federal market. Click through to explore the Index and discover what the data says about your company’s true competitive strength—and where to focus next to win.
1. Overview
This page has an overview of competitive awards for all companies currently included.
1a. Competitive Rankings
This graphic shows the ranking of each company based on their competitiveness. The rank can be found to the right of each bar. The bars themselves represent the scale of competitiveness.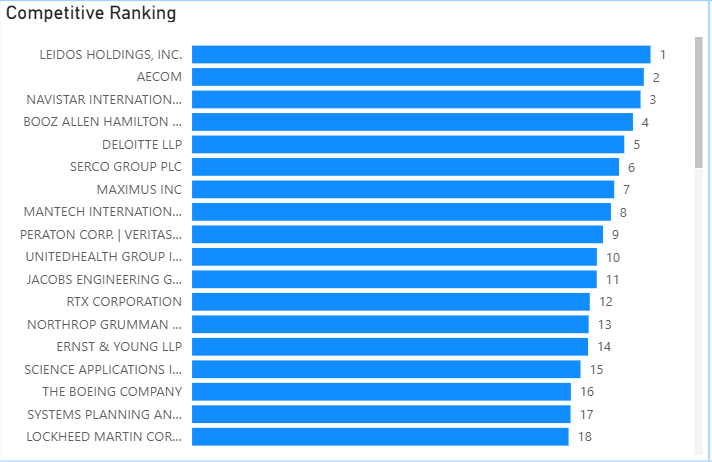
1b. Market Share
This graphic shows the market share of competitive awards by company.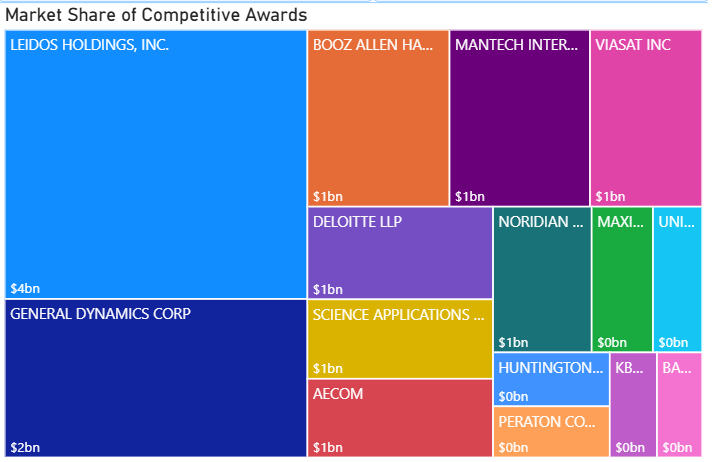
1c. Overview Table
The table at the bottom provides details for each company surrounding market share and competitiveness.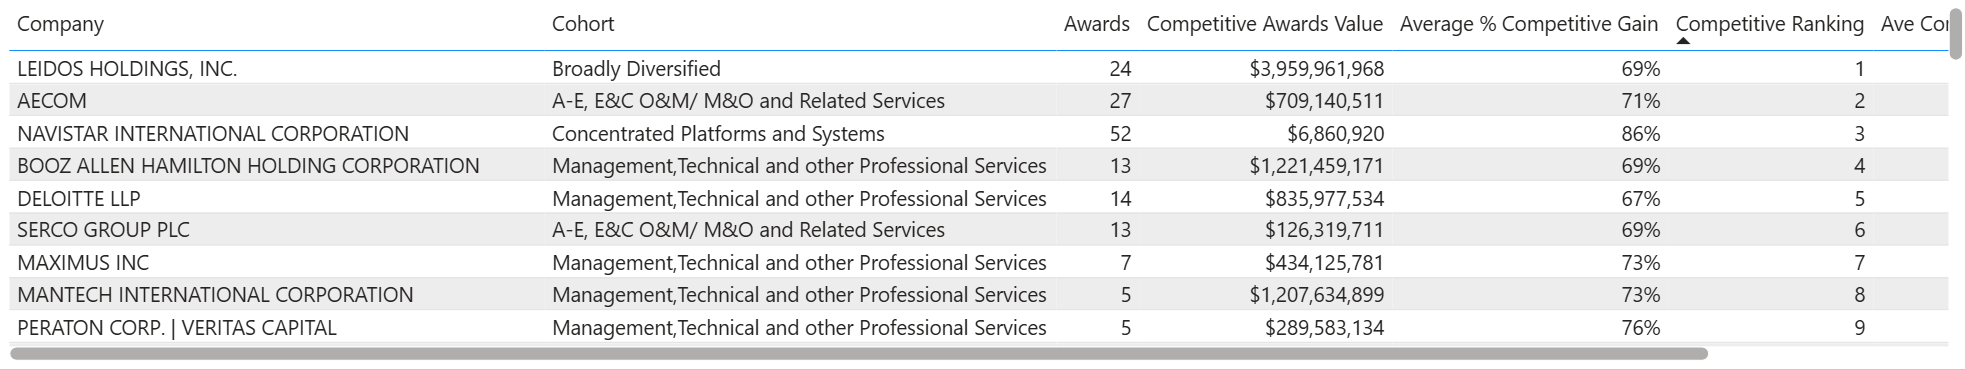
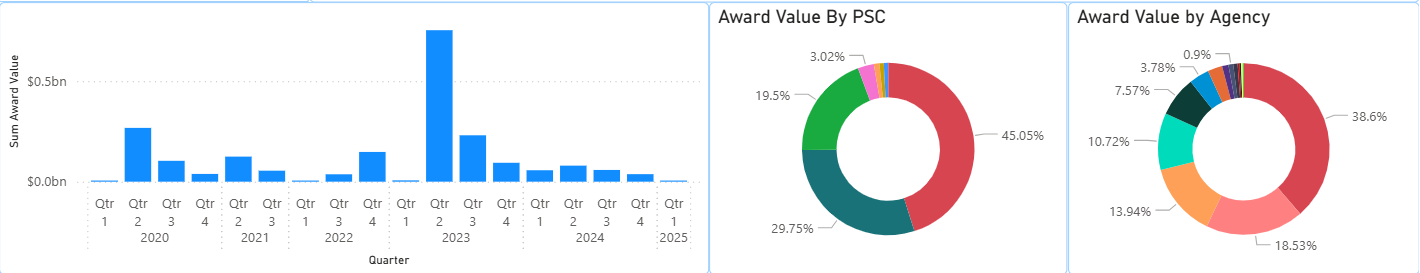
2. Company Spending
This page provides detailed information on a company level. The two main graphics show the rolling average of the company’s competitiveness over time at various lag values, and the momentum of change in their competitiveness (ROC = Rate of Change).
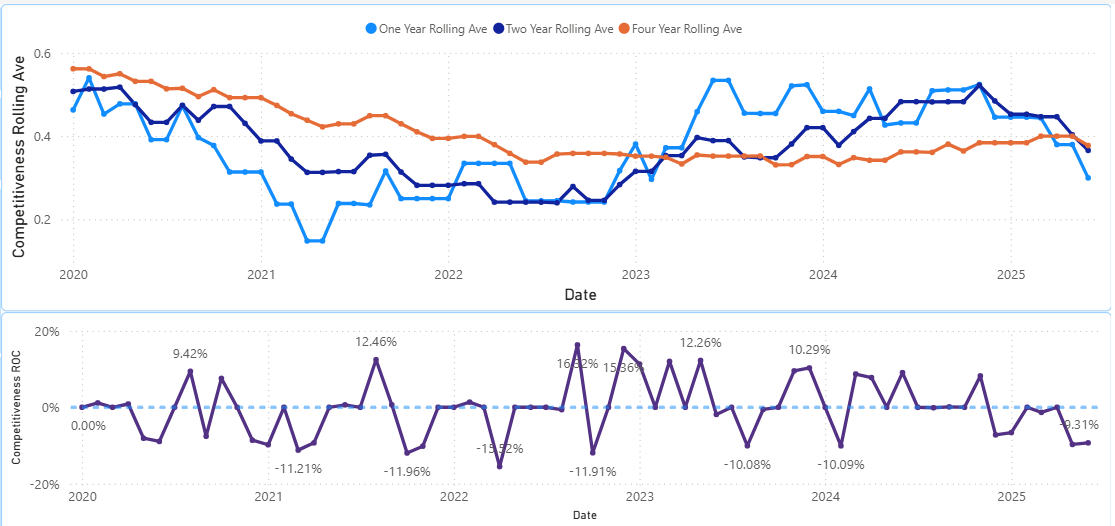
The lower half of the page shows how the competitive award dollars for the company are broken up by time, PSC, and Agency.
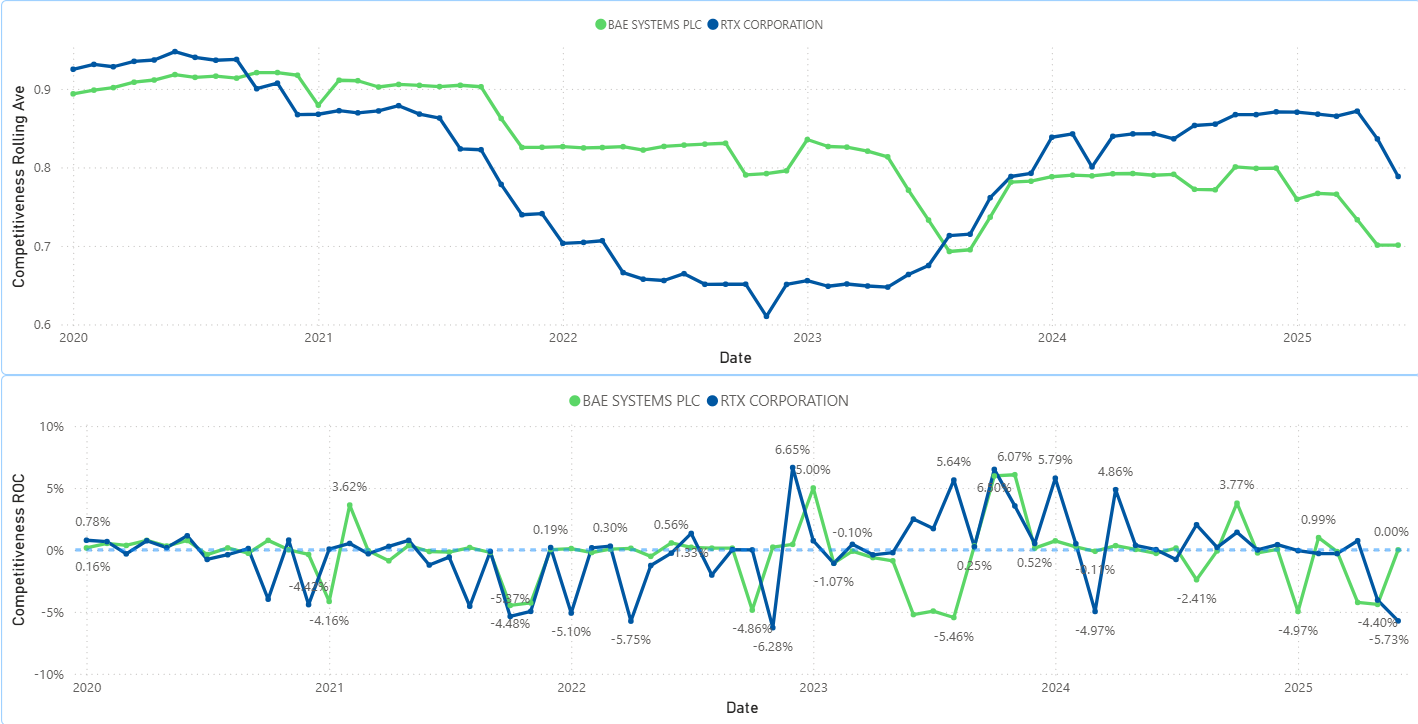
3. Trending Comparison
This page allows for the competitive trend and momentum of two or more companies to be compared.
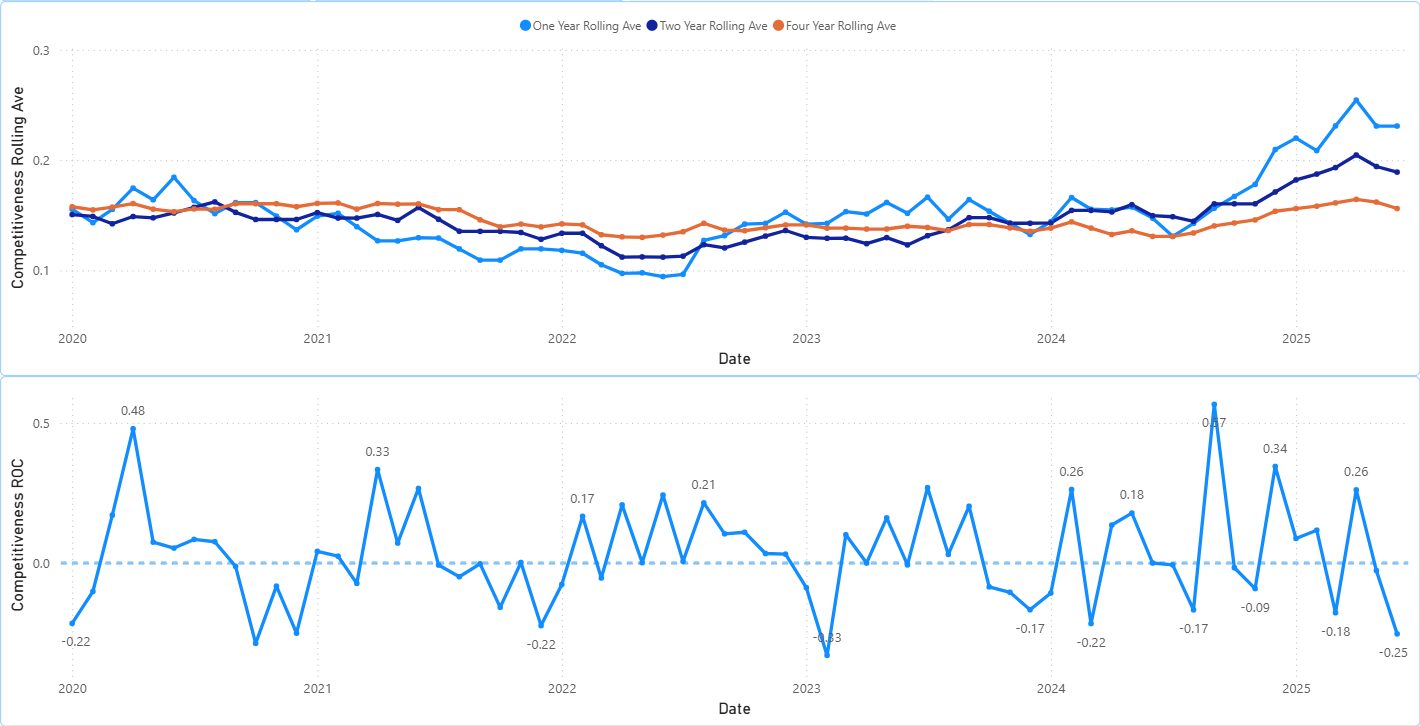
4. Trending by Group
This page displays the competitive trend and momentum of multiple companies aggregated together. This can be used to get an idea of the competitive landscape for a particular market segment over time.
Metrics Used
- Competitive Ranking: This is the main metric used for ranking. Takes into consideration how many competitive awards each company has won, the total value of those awards, and just how heavily competed each award was.
- Competitive Market Share: The dollar amount awarded to each company.
- Competitive Gain: The proportion of dollars each company won above the expected value assuming even odds.
- Competitors Weighted by Dollar: Average number of competitors per competition weighted by dollar value.
- Rolling Ave: A smoothed average used to capture long term trends.
- Competitive ROC (Rate of Change): A momentum indicator that gives the percentage change in value from one period to the next. Used to identify tend strength.


