

10 minute read
Image: Song_about_summer at stock.adobe.com
June 30, 2025
A more in-depth instruction in the use of Filters Interactively in Empower while analyzing project cost and schedule data
By Alan Kristynik, PMP
Encore Analytics Empower is a server-based analytical tool that combines earned value, project schedule(s) and other key information to provide immediate productivity for Project Directors, Project/Program Managers, Control Account Managers, Project Controls Manager/Staff and Organizational Compliance personnel with rich, integrated and interactive system for proactive management of complex projects. Empower is specifically designed to quickly locate problem areas, identify trends, display element-of-cost information, graphically display schedule Gantt information, provide immediate insight into data quality issues.
Introduction
This article provides users with detailed guidance on using Interactive Filters for analyzing project cost and schedule data. The interactive filter parameters covered in the second part of this three-part series include:
- Numeric Fields
- Date Fields
- Standard Text Fields
Empower Sort Window
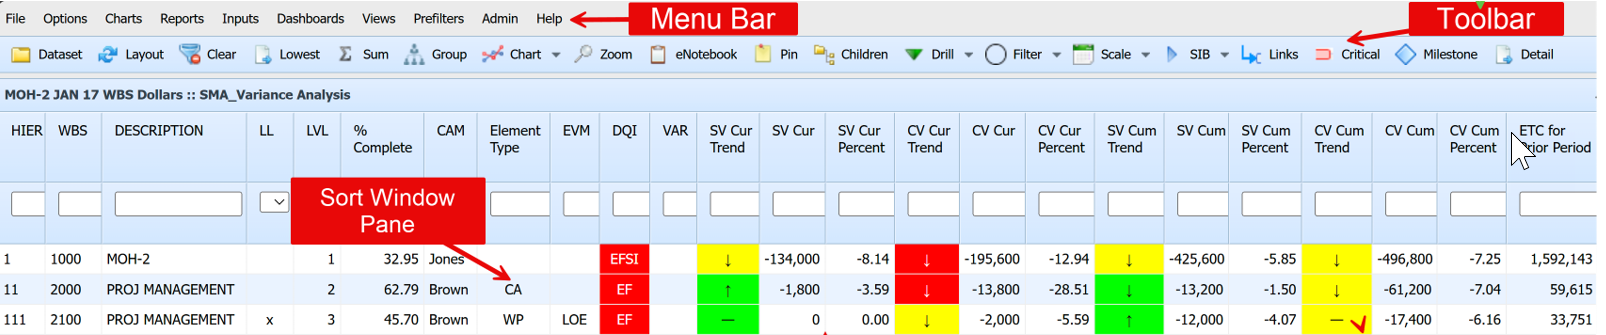
Empower presents information in three primary windows, called the Sort, Chart, and Report Windows. The Sort Window is at the top of the Empower window, with the Chart Window and Report Window side by side and below the Sort Window. For Interactive Filters, our focus is primarily with the Sort Window as seen below:
Interactive Filters
The main advantage of interactive filters in Empower is that they allow for real-time data analysis without having to pre-set filters ahead of time:
- Rules for entering filter criteria in these filter boxes vary, depending on the nature of the data in the given column (i.e., numeric, text, or date field).
- You can enter more than one filter criterion; multiple filter criteria are always joined with a logical AND. Status Bar displays active Filter.
- Use the “Clear” toolbar option to clear interactive
You can quickly specify criteria to view only the rows of data you’re interested in. Key features of Interactive Filters in Empower:
- Filter Bar. Located directly beneath the column headers in the Sort View, this intuitive and accessible tool allows users to easily apply filters to the data displayed in the Sort Window:

- Conditions Data by Rows. Interactive filters let users narrow down data by applying specific conditions to rows, aiding focused analysis. This is useful for refining results based on criteria like data quality indicators, variance trends, dates, or other parameters supported in Empower.
- On-the-Fly Filtering. Interactive Filtering lets you create filters quickly by entering criteria in the Filter Bar beneath column headers. For example, inputting a value range instantly shows only matching data, making analysis easier.
- Instant Application of Filters. Upon entering filter criteria into the data column, the Sort Window is promptly updated to reflect only those rows that satisfy the specified conditions. This immediate feedback enables users to streamline their datasets efficiently, thus reducing delays and enhancing the accuracy of their analysis.

Interactive Filter Parameters
The following are the parameters supported by Empower for filtering data interactively:
Numeric Fields
Empower supports interactive filters for numerical fields associated with common EVM metrics:
- BAC (Budget at Completion)
- EAC (Estimate at Completion)
- CPI (Cost Performance Index)
- SPI (Schedule Performance Index)
- ACWP (Actual Cost of Work Performed)
- BCWP (Budgeted Cost of Work Performed)
- BCWS (Budgeted Cost of Work Scheduled)
These filters can be applied in various Empower dashboards and views to:
- Narrow results based on thresholds (e.g., CPI < 0.95 to flag underperforming work packages).
- Highlight projects or control accounts with SPI variances beyond specified limits.
- Focus analysis on high-risk or high-value areas (e.g., EAC > BAC).
- Enable trend analysis or performance monitoring over time.
Empower’s filter tools are designed to be interactive, user-friendly, and customizable, allowing users to define and save views that support data-driven decision making and EVMS compliance monitoring.
The following operators are used for numeric fields:
| Input | Result Description |
|---|---|
| =N | Equal to |
| <> N | Not Equal to |
| >N | Greater than |
| <N | Less than |
| <=N | Less or equal |
| >=N | Greater or equal |
| N1..N2 | Range of values |
Numeric Fields – Interactive Filter
The SMA_Performance Indices View contains the following example columns to render Number Interactive data quality results:
| Input Column | Variance Description |
| WP | Element Type |
| SPI Cum | Schedule Performance Index Cumulative |
| CPI Cum | Cost Performance Index Cumulative |
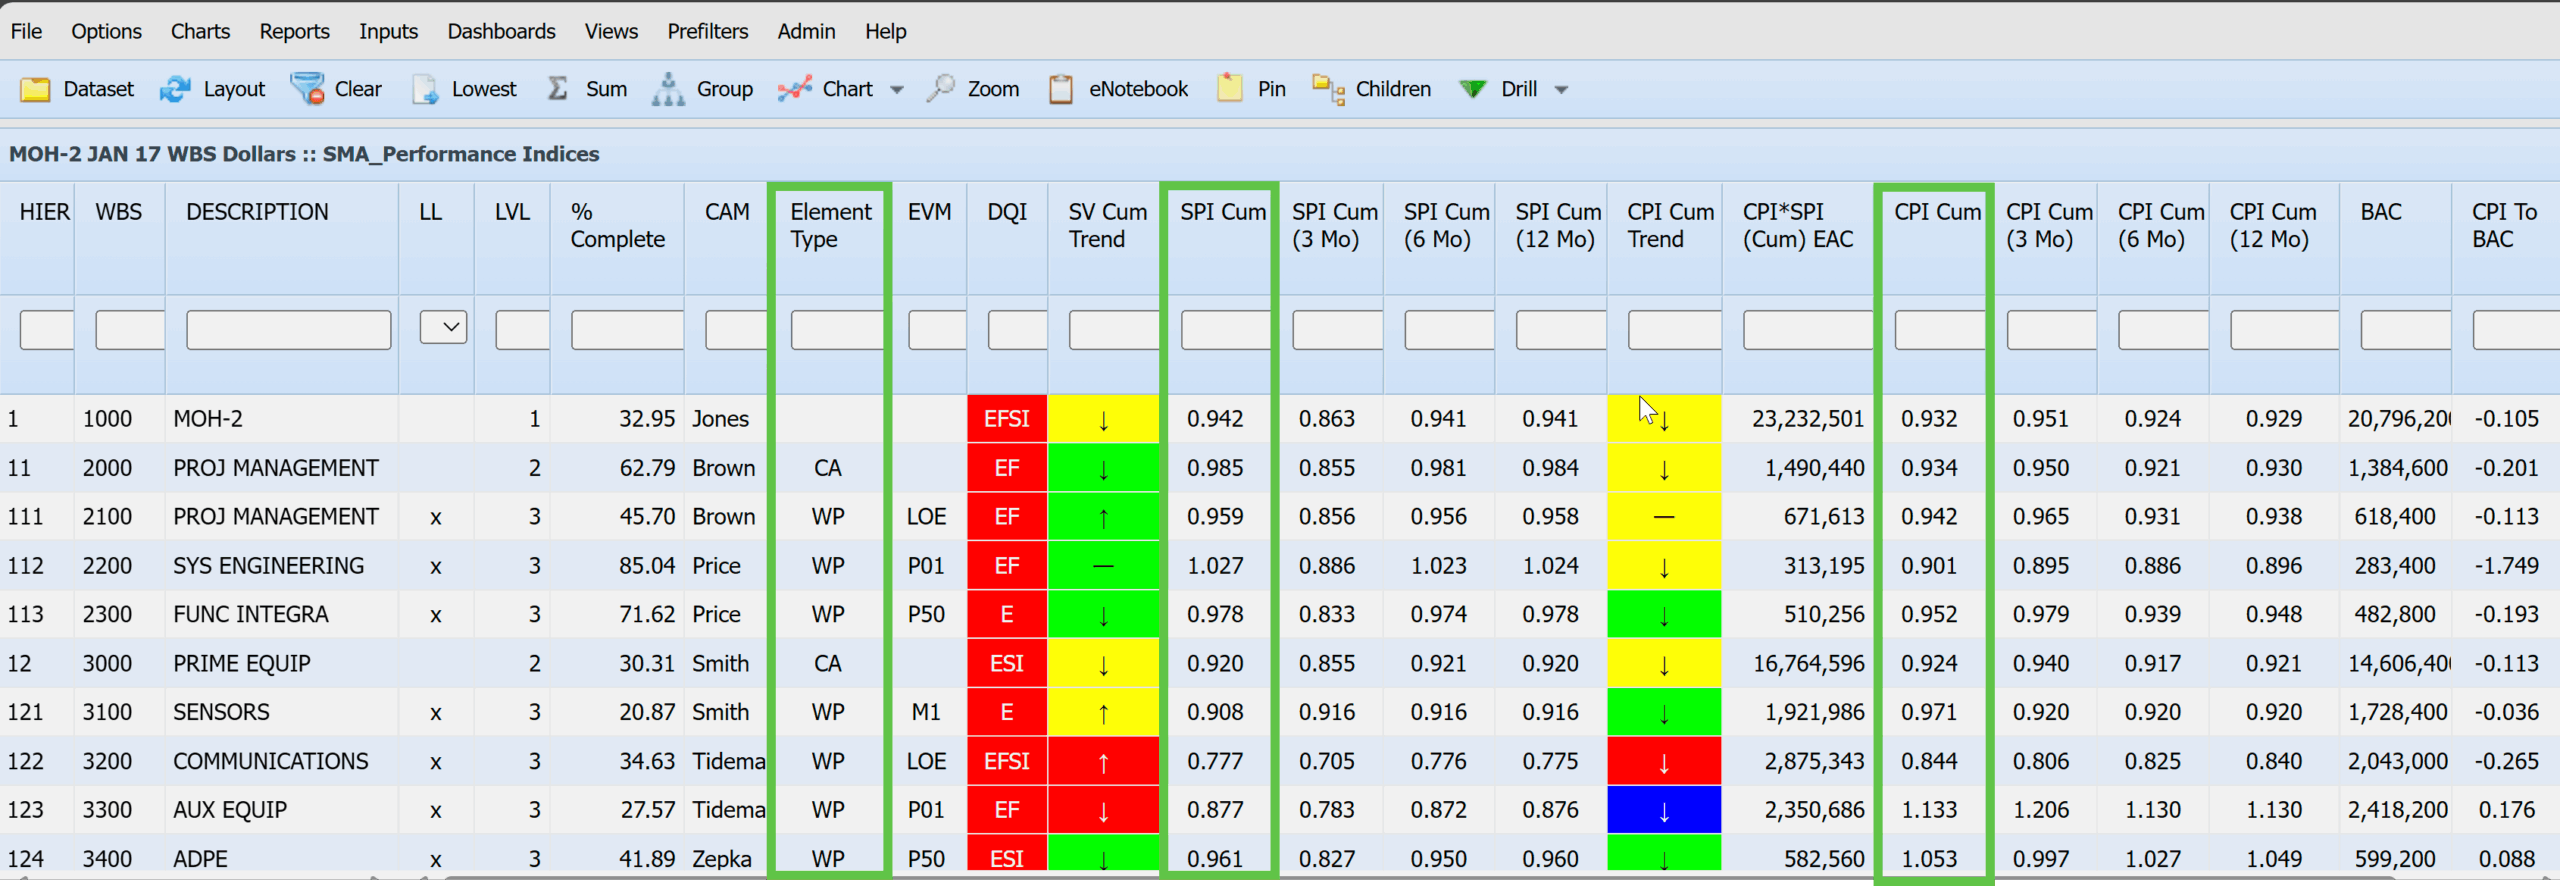
Numeric Fields – Interactive Filter Exercise
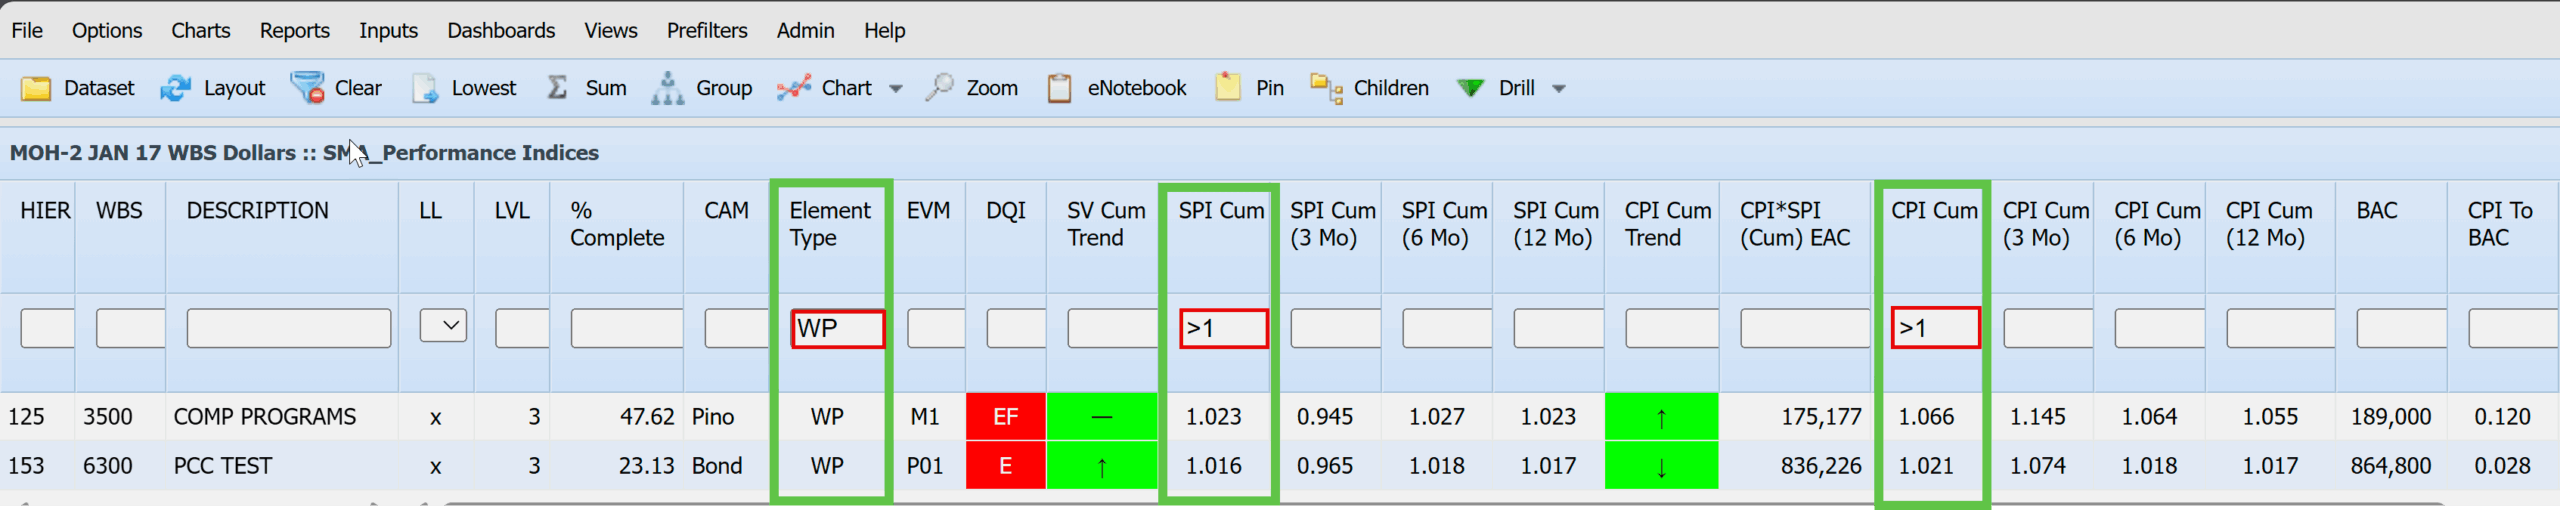
The application of the interactive numeric filter has resulted in the following WBS Elements at the element type of WP (Work Package) showing CPI Cum and SPI Cum greater than (>1) based on the following common calculations:
| Result | Formula | Analysis |
|---|---|---|
| SPI | SPI=BCWP/BCWS | This measure can apply to current data, cumulative data, or some increment in between, such as the last three months or the last six months:
SPI is especially useful for trend analysis and schedule health checks. However, SPI becomes less reliable late in the project (when PV plateaus), so it’s often paired with critical path analysis or IMS status |
| CPI | CPI=BCWP/ACWP | This measure can apply to current data, cumulative data, or some increment in between, such as the last three months or the last six months:
CPI is a key metric used in Earned Value Management (EVM) to measure the cost efficiency of a project |
The application of the interactive numeric filter has resulted in the following Work Package (WP) Elements showing both cost and schedule efficiency:
| WBS | Description | CAM |
|---|---|---|
| 3500 | COMP PROGRAMS | Pino |
| 6300 | PCC TEST | Bond |
Date Fields
If the column contains date or date/time values, you enter the date part in the order four-digit year, month, day, with or without a dash between the parts (e.g., yyyy-mm-dd or yyyymmdd). You can enter the time part as hh:mm:ss, or hhmmss, with either a blank or a period to separate the date from the time.
You only need to enter as much of the time part as logically necessary for your filter.
If you want to filter for times after 2 p.m., you only need to enter 14; you don’t need to enter 140000 or 14:00:00. You can filter date or date/time columns by specifying the exact timestamp you want to match, or you can use the comparison operators listed above. As an example, the following would all be legal ways to filter for dates after October 25, 2016, at 7 a.m.:
- >2016-10-25 07:00:00
- >2016-10-25 07
- >20161025 07
- >20161025.070000
- >20161025.07
Entering a blank character will filter for columns with no date.
We now discuss a group of date columns that can be used for any purpose but are particularly intended for filtering. These date columns fall naturally into four groups of three. The middle of each group is a schedule date (from the element’s linked tasks), which should lie on or between the dates on either side. To the schedule date’s left is the corresponding beginning-of-period cost date (from the element’s Earned Value or Future Etc records); to its right is the corresponding end of-period cost date. If schedule data is not present, the schedule-related fields (the middle in each group of three) will naturally be blank.
Date Fields – Interactive Filter
The operators above also work with date/time data. For example:
| Input | Result Description | Date Example |
|---|---|---|
| =N | Equal to | =2021-04-15 |
| <> N | Not Equal to | <>2021-04-15 |
| >N | Greater than | >2021-04-15 |
| <N | Less than | <2021-04-15 |
| <=N | Less or equal | <=2021-04-15 |
| >=N | Greater or equal | >=2021-04-15 |
| N1..N2 | Range of values | 2021-04-15..2021-05-15 |
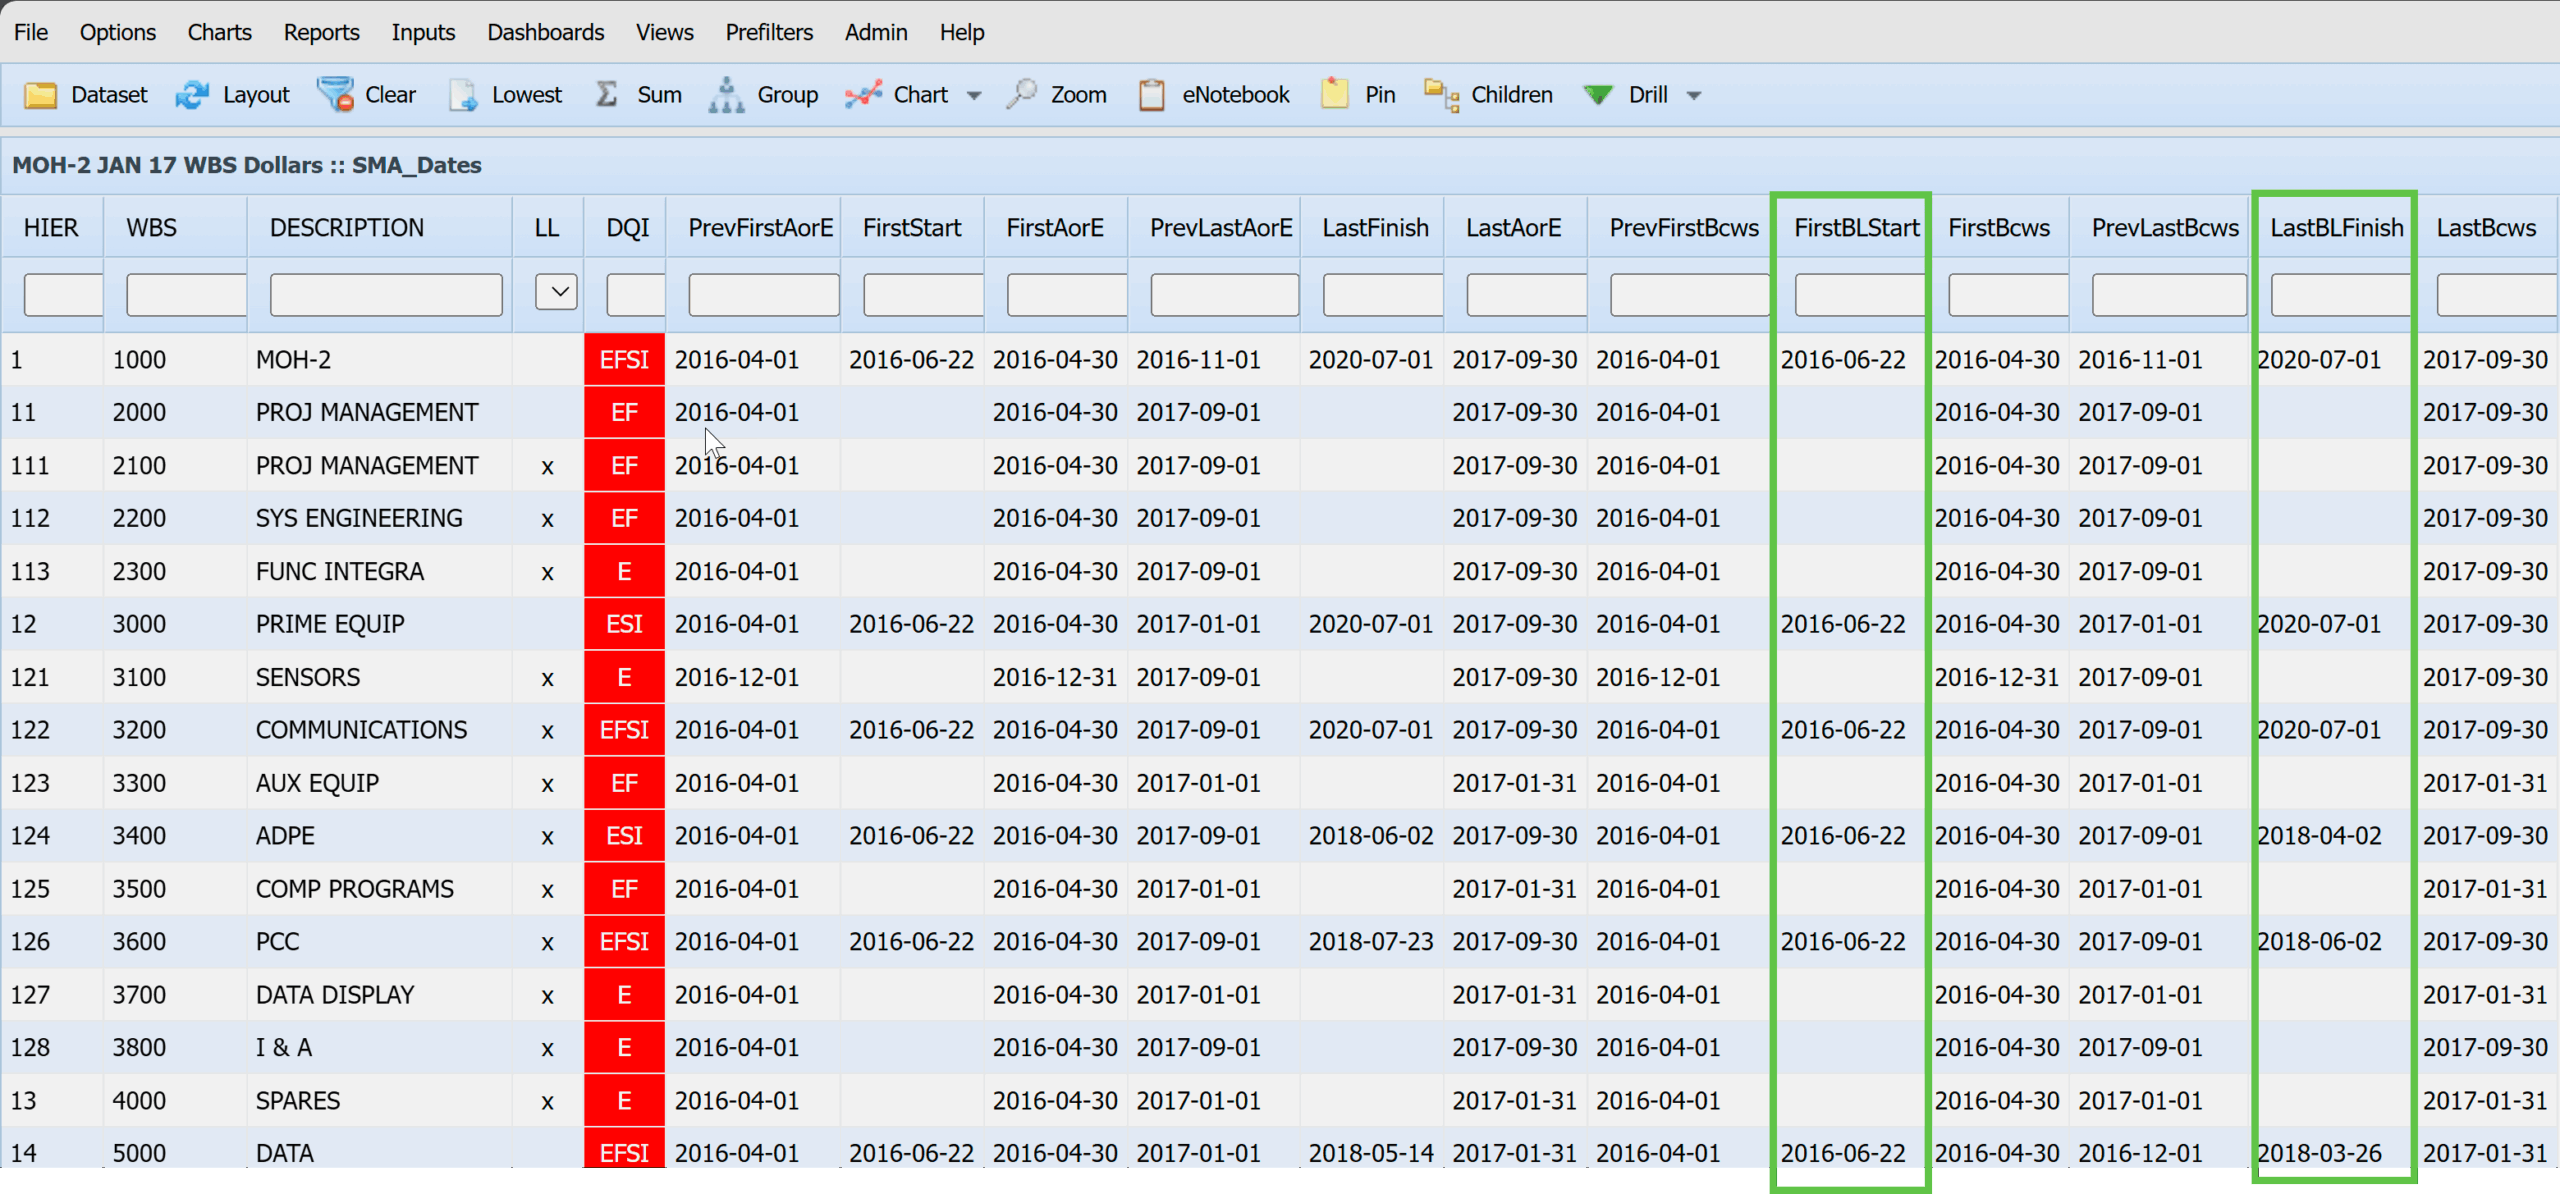
The SMA_Dates View contains the following columns to render Date Interactive data quality results:
| Date Column | Column Definition |
|---|---|
| PrevFirstAorE | Previous Period Cumulative ACWP |
| FirstStart | First Linked Task Start |
| FirstAorE | End of First Period with ACWP or ETC |
| PrevLastAorE | Beginning of Last Period with ACWP or ETC |
| LastFinish | Last Linked Task Finish |
| LastAorE | Last Linked Task Finish |
| PrevFirstBcws | Beginning of First Period with BCWS |
| FirstBLStart | First Baseline Start |
| FirstBCWS | First BCWS |
| PrevLastBcws | Beginning of Last Period with BCWS |
| LastBLFinish | Last Baseline Finish |
| LastBcws | Last BCWS |
Date Fields – Interactive Filter Exercise
Enter the following Date Interactive Filter Criteria:
| Input | Result Description | Date Example |
|---|---|---|
| =N | Equal to | =2016-06-22 |
| >N | Greater than | >2018-03-26 |
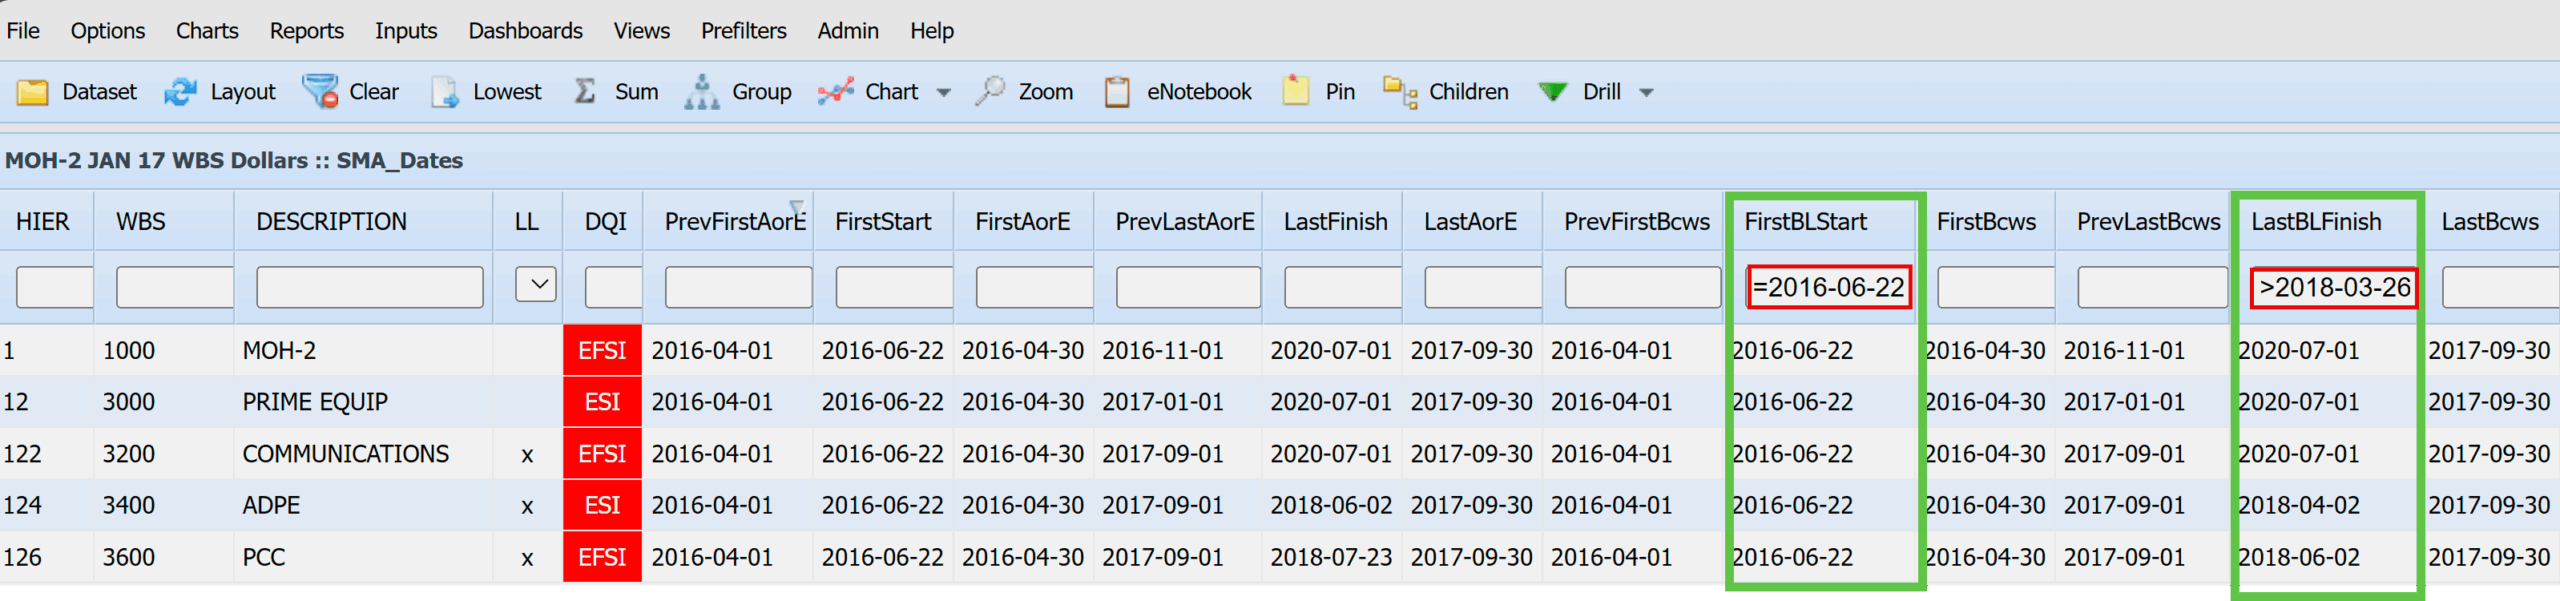
The application of the interactive date filter has resulted in the following WBS Elements showing the desired dates:
| WBS | Description |
|---|---|
| 1000 | MOH-2 |
| 3000 | PRIME EQUIP |
| 3200 | COMMUNICATIONS |
| 3400 | ADPE |
| 3600 | PCC |
Standard Text Fields – Interactive Filter
For text fields, the user simply enters some text, and the filter returns all elements where the first characters in the column match the filter criterion. For instance, if the user entered “SMITH” in the CAM filter box, the filter would return elements in which the CAM was named SMITH, or SMITHSON, or SMITHSONIAN, and so on). Text fields also allow the use of a logical OR to specify multiple conditions for a column. Standard text fields execute with “begins with” function(s). Text Fields are Case Sensitive. They also allow the use of a logical OR to specify multiple conditions for a column.
Text Fields – Interactive Filter
| Functions | Uses | Example |
|---|---|---|
| Or | | (pipe) | Troop|Price in the CAM column would return all elements where Troop OR Price was the CAM |
| Not | ! | !LOE in the EVM column would return all elements where the EV Method was not LOE |
| Populated Field | “__” | An underscore in the VAR column would return all elements where a VAR threshold was breached |
| Blank or Null Values | (space) | A space in the EVM column would return all elements without an assigned EVM |
| Exact Match | $ | “SIMULATION$” in the Description column would return only “SIMULATION” but not something like “SIMULATION COCKPIT” or “SIMULATIONS” |
| Contains | % | “%TEST” in the Description column will return all WBS Elements with TEST in the description column |
Standard Text Fields – Interactive Filter Example 1
The SMA_Variance Analysis View contains the following columns to render Text Field Interactive data quality results:
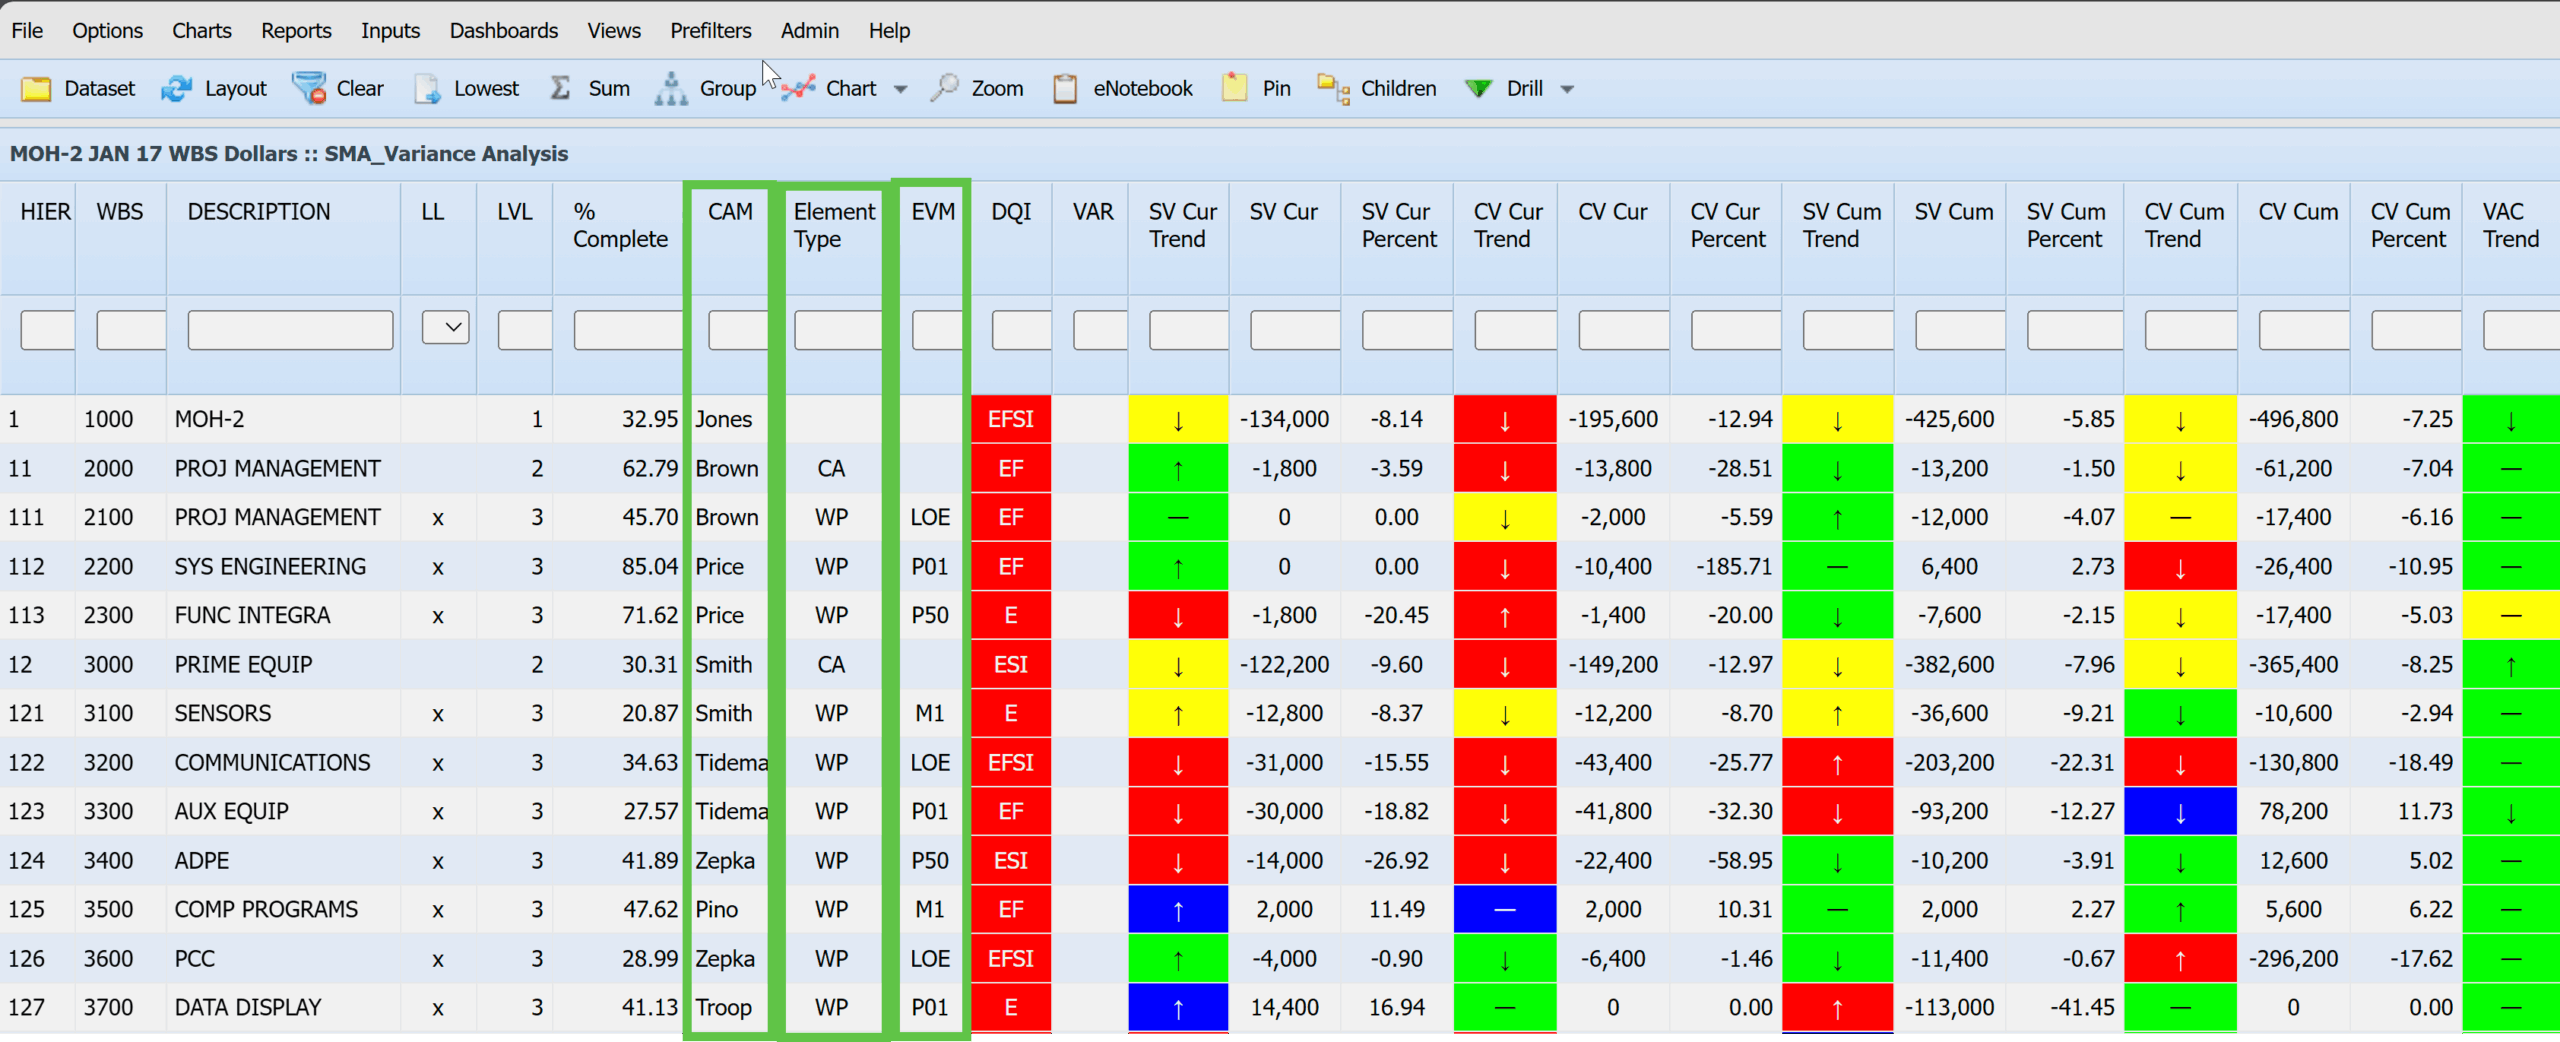
Enter the following Standard Text Interactive Filter Criteria:
| Text Field | Input | Result |
|---|---|---|
| CAM | Troop|Zepka | Returns WBS Elements where Troop OR Zepka are Assigned |
| Element Type | WP | Returns WBS Elements with WP as Element Type |
| EVM | !LOE | Returns WBS Elements where LOE is not the EVM Method |
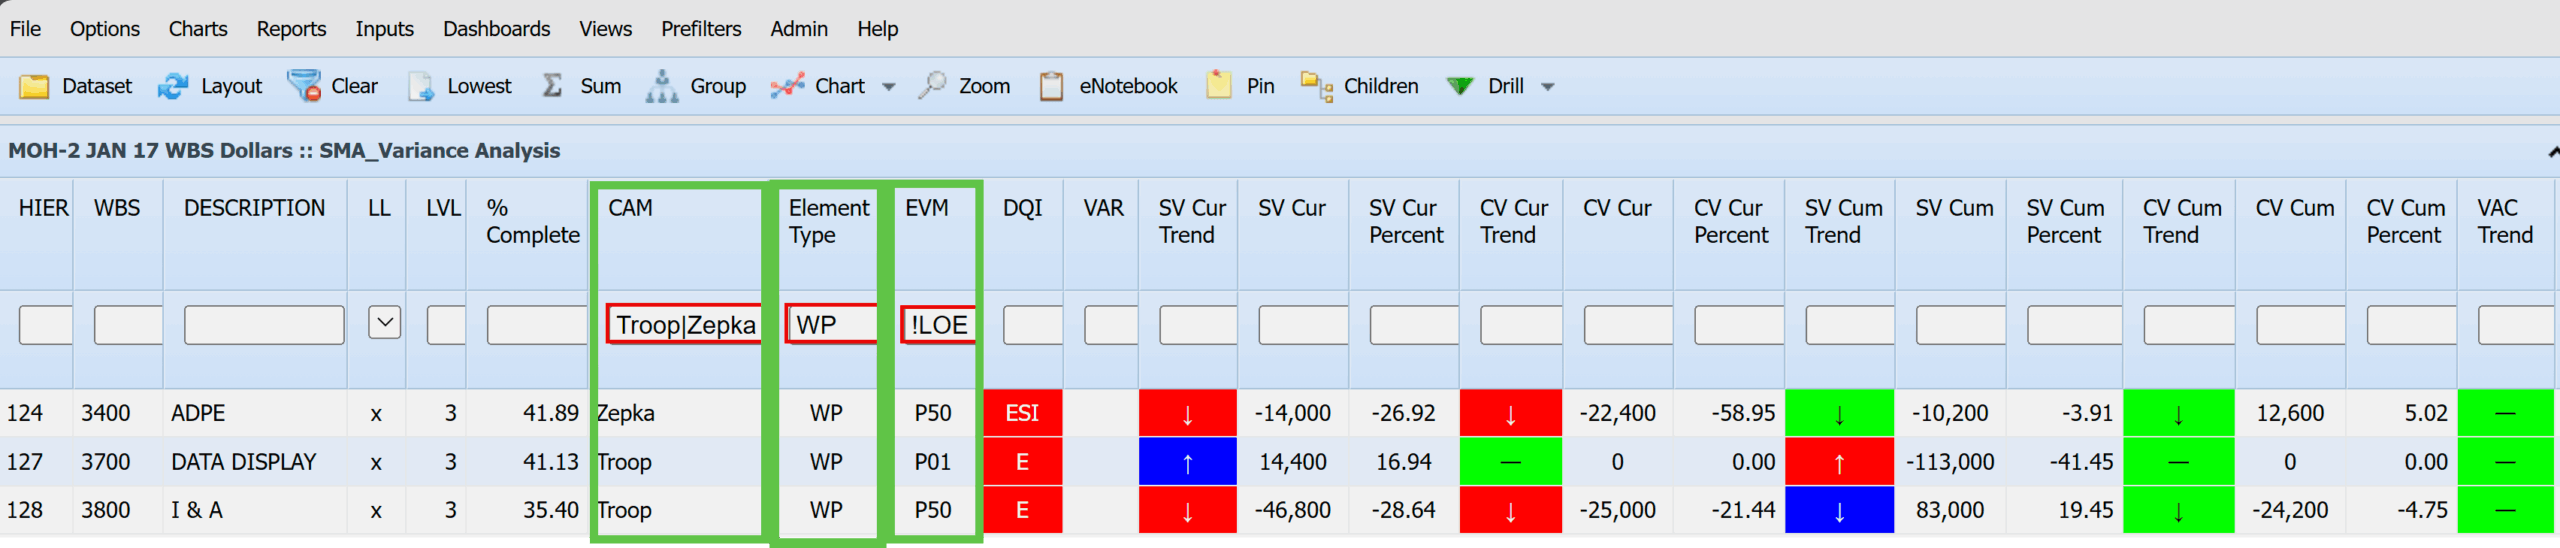
The application of the interactive text filter has resulted in the following WBS Elements showing the desired results for CAM, Element Type and EVM:
| WBS | Description |
|---|---|
| 3400 | ADPE |
| 3700 | DATA DISPLAY |
| 3800 | I & A |
Standard Text Fields – Interactive Filter Example 2
The SMA_Variance Analysis view contains the following columns to render Text Field Interactive data quality results:
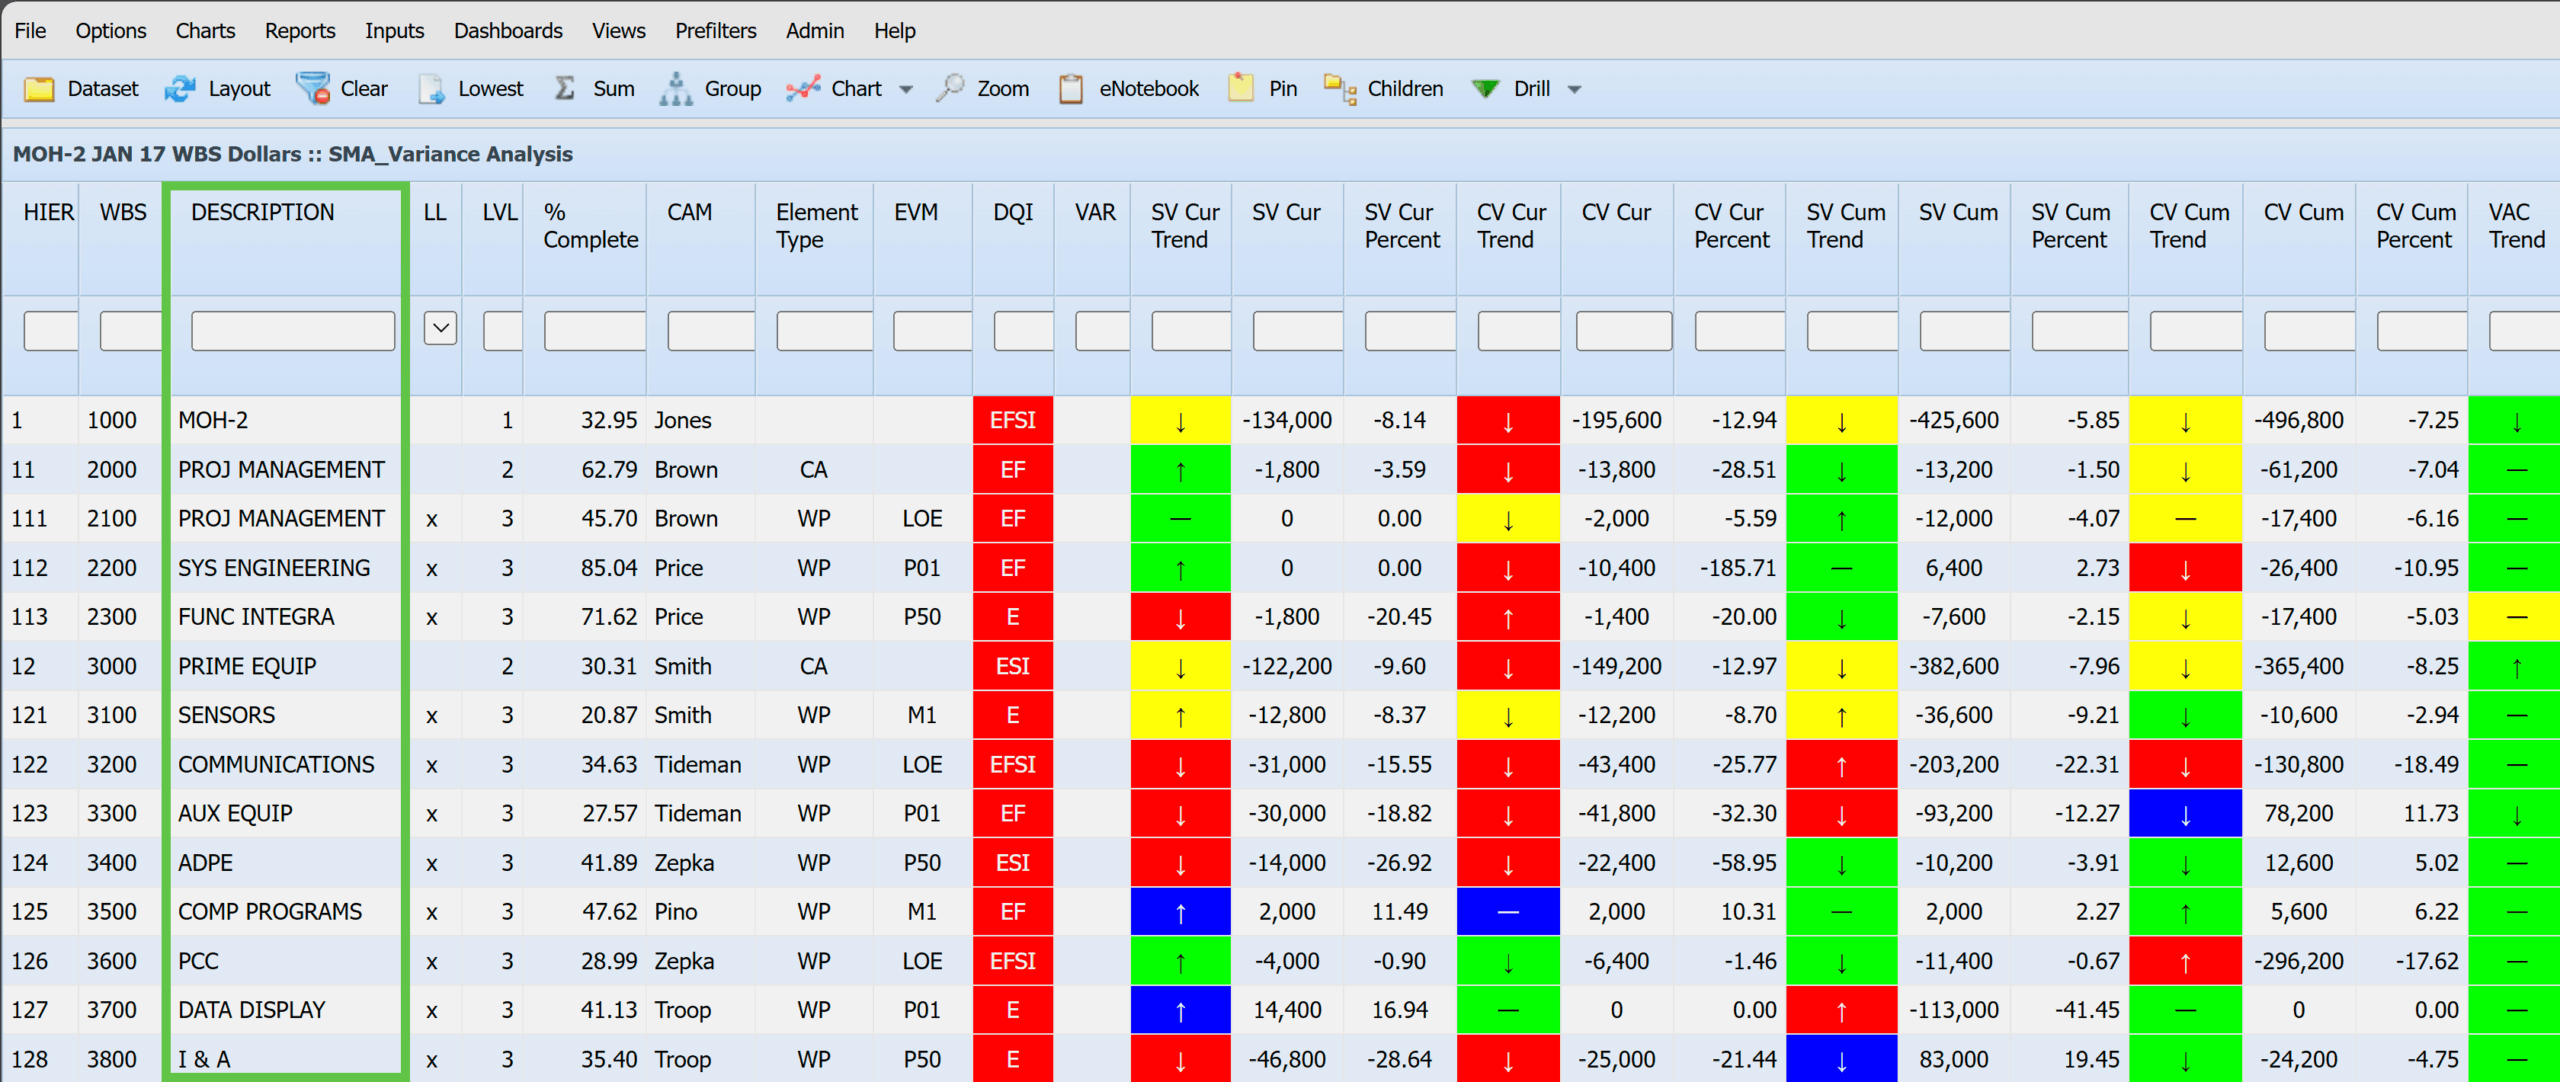 Enter the following Standard Text Interactive Filter Criteria:
| Text Field | Input | Result |
|---|---|---|
| Description | %MANAGEMENT | Return all WBS Elements with MANAGEMENT in the Description Column |
The application of the interactive text filter has resulted in the following WBS Elements showing the desired results for MANAGEMENT:
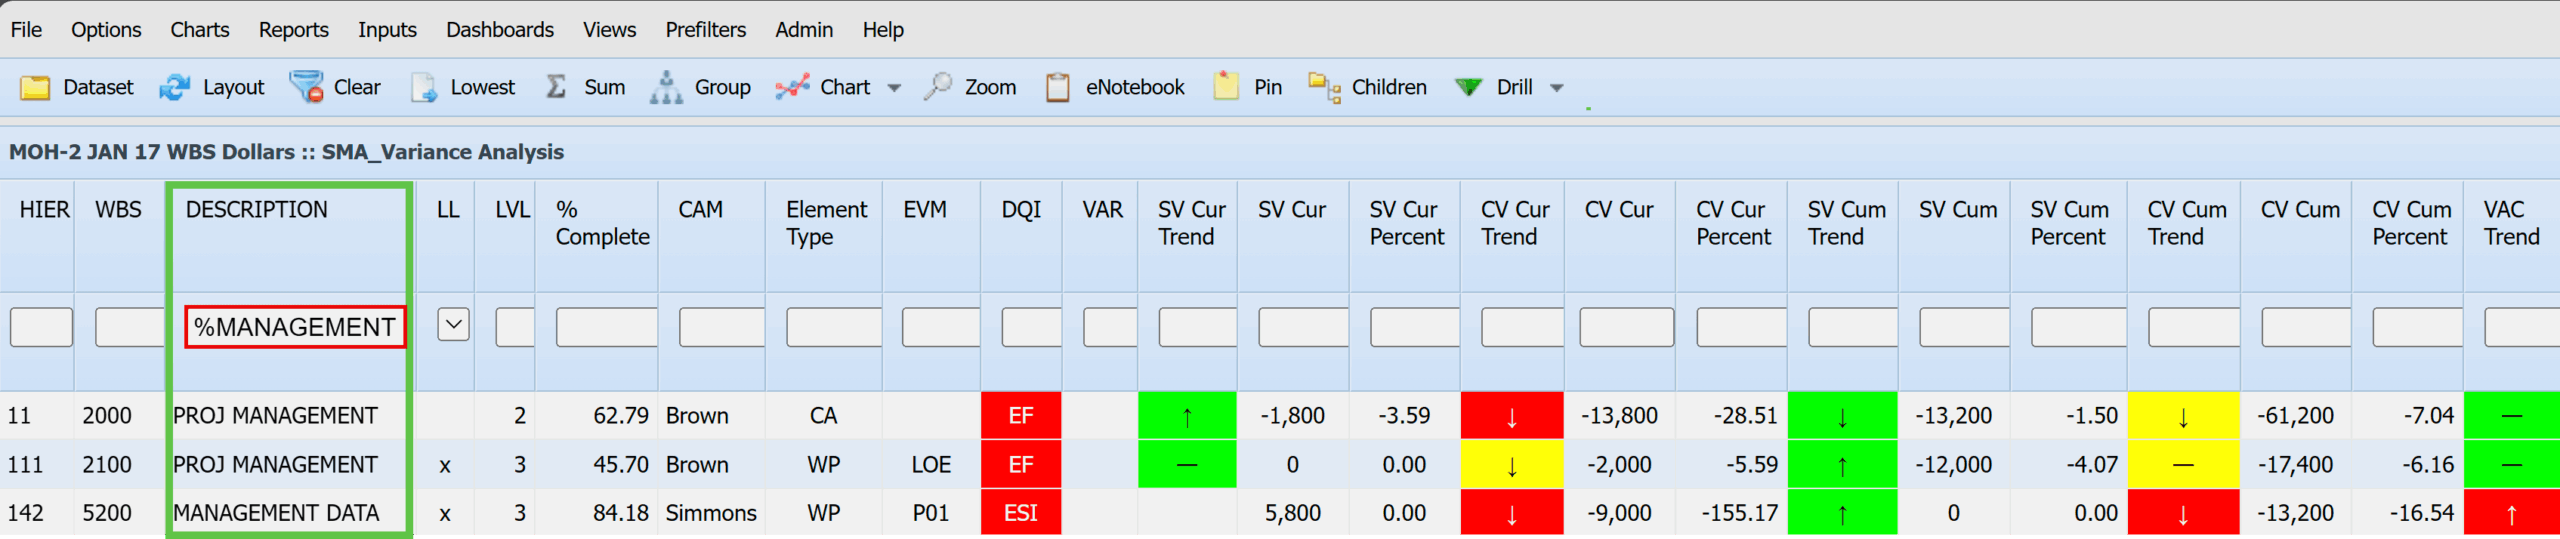
| WBS | Description | Element Type |
|---|---|---|
| 2000 | PROJ MANAGEMENT | CA |
| 2100 | PROJ MANAGEMENT | WP |
| 5200 | MANAGEMENT DATA | WP |
Summary
Empower provides tools to identify problem areas, recognize trends, display cost information, graph schedule Gantt charts, gain insight into quality issues, and streamline the creation of narratives and corrective actions through integrated workflows. The primary advantage of interactive filters in Empower is that they facilitate real-time data analysis without requiring pre-set filters. Stakeholders involved in program management using Empower can effectively utilize program performance data for managing complex projects without needing extensive training or complicated MS Windows desktop client installations.
 |
Alan Kristynik, PMP, GWCPM, is a Senior Associate in SMA’s Integrated Program Planning & Controls (IPPC) Practice, and has a Deltek Cobra Master Certification. He has been a Certified Project Management Professional with PMI since 1998, has an active DoD Top Secret clearance, and is a Subject Matter Expert in Earned Value Management Systems (EVMS). |
Posted on June 30, 2025, by
Dick Eassom, CF APMP Fellow, SMA, Inc.


