

25 minute read
Image: Degimages at stock.adobe.com
November 24, 2025
1. The Catalyst for Integrated Performance Management 2.0
The defense acquisition ecosystem is entering a period of unprecedented change. The Department of Defense’s Acquisition-Transformation Strategy signals a decisive shift away from slow, document-centric processes and toward a modern model built on speed, adaptability, and continuous learning. The Strategy stresses decision advantage, digital integration, and rapid capability delivery as essential ingredients for maintaining operational superiority. In this evolving environment, programs must operate inside compressed timelines, iterate quickly, integrate software and hardware seamlessly, and manage risk dynamically across domains that were once siloed.
Yet the program-control systems designed decades ago were never built for this world. They were created for sequential development, predictable baselines, infrequent change, and long decision cycles. They assume that cost, schedule, and technical performance can be planned early, measured infrequently, and reported after the fact. The Acquisition-Transformation Strategy exposes the limits of this thinking. It calls for real-time awareness, digital continuity, integrated assessment, and proactive governance. Capabilities that traditional Earned Value Management and legacy program-control structures cannot support.
This creates a critical inflection point. If acquisition is transformed to accelerate capability delivery and enhance warfighter advantage, then program control must transform in parallel to supply the decision intelligence that modern acquisition requires. Integrated Performance Management (IPM) 2.0 emerges as the necessary enabler of this transformation. It replaces fragmented data, delayed insight, and compliance-oriented reporting with a connected, predictive, and collaborative performance ecosystem.
IPM 2.0 does not alter the direction of acquisition reform; it operationalizes it. It provides the digital fabric, integrated ledger, advanced analytics, and collaborative decision workflows required to shorten decision cycles, reduce uncertainty, and align resources with mission value. In short, the catalyst for IPM 2.0 is the growing gap between the speed at which acquisition must operate and the pace at which traditional program-control systems can respond. Bridging that gap is no longer optional, it is essential to sustaining decision advantage in a rapidly changing threat environment.
2. Traditional Program Control System Has Reached Its Breaking Point
Program control is collapsing under its own weight. What once worked in a slow, linear acquisition world now fails under digital, iterative, high-pressure delivery. The defense and aerospace environment is transforming faster than traditional program-control systems can adapt. Legacy Earned Value Management (EVM) approaches, designed for linear development and static baselines, cannot meet the needs of digital engineering, Agile acquisition, and rapid capability delivery. Integrated Performance Management (IPM) 2.0 replaces compliance reporting with continuous intelligence, integrating technical, schedule, and cost data into a living decision-support ecosystem depicted in Figure 1.
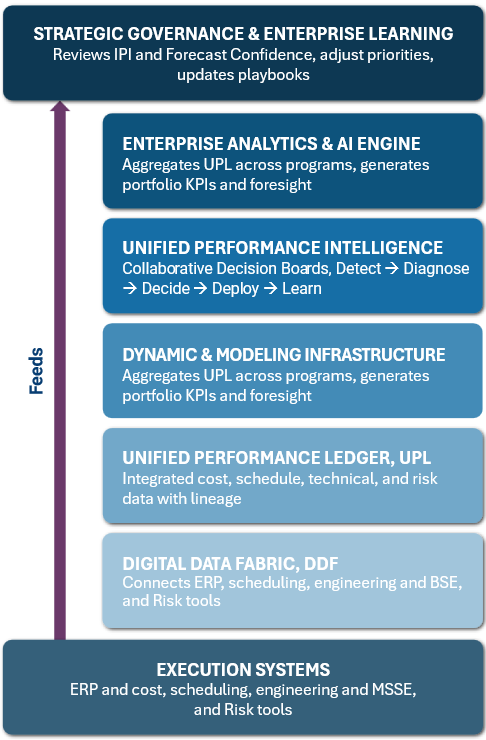
Figure 1: IPM 2.0 Ecosystem from Data to Decision to Learning.
IPM 2.0 is founded on a Digital Data Fabric (DDF) that connects all source systems, a Unified Performance Ledger (UPL) that serves as the single source of truth, an Analytics and AI Engine that transforms data into foresight, and Collaborative Decision Boards that turn foresight into action. The outcome is a performance architecture that accelerates decisions, predicts risk, and learns continuously.
This model does not abandon discipline; it modernizes it. Data transparency replaces manual reporting, predictive analytics replaces static variance tracking, and collaborative intelligence replaces command and control intermediaries. The result is faster capability delivery, improved forecast confidence, and stronger mission alignment.
Why: Programs must make faster, data-informed decisions that connect engineering reality, delivery rhythm, and investment efficiency to mission value.
How: IPM 2.0 integrates a digital data fabric, a unified performance ledger, and an analytics and AI engine with collaborative decision boards and outcome-oriented metrics.
What: A real-time decision-support framework that delivers transparency, prediction, and coordinated action across the enterprise.
3. The Digital Fabric: Ending the Era of Data Fragmentation
Every major program today suffers from a common but often invisible problem: fragmented data that forces teams to manage in the dark. Cost systems, scheduling tools, Agile boards, engineering repositories, and risk registers frequently operate as isolated islands of information. Each system presents its own view of performance, accurate within its boundaries but incomplete when considered against the totality of the program. Program teams spend enormous amounts of time reconciling these dis-connected data sources instead of interpreting them. The result is slow situational awareness, inconsistent insights, and delayed or misinformed decisions.
If fragmentation is the root problem, then integration must be the foundation of the solution. IPM 2.0 begins by rebuilding the program’s data layer from the ground up. Rather than treating cost, schedule, technical, and risk data as separate domains that must be periodically aligned after the fact, IPM 2.0 connects them through a Digital Data Fabric that operates continuously and automatically. The Digital Data Fabric is designed to end the era in which programs accept multiple “sources of truth” as inevitable. Financial systems reflect one version of progress, the Integrated Master Schedule reflects another, and Agile or DevSecOps tools, MBSE environments, and digital engineering repositories reflect others still. None of these systems alone can describe the integrated state of the program. The effort required to manually stitch them together is precisely what drives latency, inconsistency, and the four to six-week reporting delays that limit the usefulness of traditional earned value practices.
The Digital Data Fabric replaces this fractured landscape with a secure, automated integration layer that synchronizes all major data domains into a single ecosystem. It continuously ingests data from enterprise resource planning systems, scheduling platforms, Agile and DevSecOps tools, MBSE repositories, configuration management systems, and risk tools. As the data arrives, the fabric validates, aligns, and normalizes every element using consistent identifiers, common timelines, and reconciled structures that preserve integrity and traceability.
The mechanics are straightforward but transformative. Instead of requiring analysts to extract files, merge spreadsheets, and manually adjust mismatched datasets, the fabric uses automated pipelines to extract, transform, and load data into the Unified Performance Ledger. Validation rules detect anomalies at the moment of ingestion rather than during downstream reporting. Lineage is preserved automatically so that every data point within the performance environment can be traced back to its original source, transformation logic, and moment of capture.
As the Digital Data Fabric operates, it continuously updates the integrated view of the program. Any change to the schedule, engineering model, test event, staffing plan, risk item, or cost transaction is propagated in near real time into the Unified Performance Ledger. The program no longer waits for the end of a reporting period to understand its own condition. Instead, it has continuous access to a living, authoritative insights of cost, schedule, risk, and technical performance.
The output of the fabric is the Unified Performance Ledger, the authoritative record of program reality. Unlike traditional input files that require manual maintenance and reconciliation, the Unified Performance Ledger is an automatically generated, always current representation of program performance. It provides a unified view of every cost element, schedule activity, engineering maturity indicator, and risk exposure, with full data lineage preserved. Because the ledger is continuously updated, decisions can be based on trusted and timely information rather than lagging indicators.
This transformation has a major operational consequence: it frees program control personnel from the burden of low-value data collection and data reduction. Analysts no longer spend their time reconstructing data from disparate systems. Instead, they can focus on interpreting integrated information, understanding cross-domain impacts, and support decisions that influence outcomes. The shift from reconstruction to comprehension marks the first major step toward performance intelligence.
The second step is a conceptual shift from treating data sources as inputs to treating the Unified Performance Ledger as the single authoritative foundation for insight. Once the ledger is established and continuously updated, it becomes the engine that powers predictive analytics, decision support, and continuous learning across the program (see Figure 2).
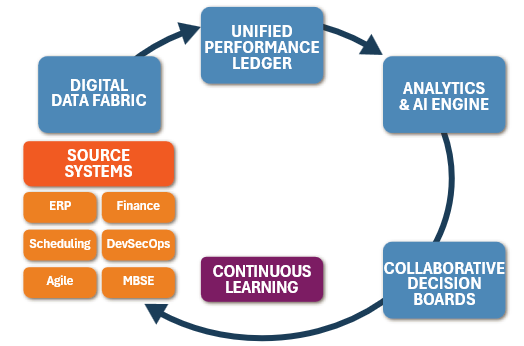
Figure 2: End-to-End Data to Decision Ecosystem.
4. Why Earned Value Cannot Keep Up with Modern Programs
Earned Value was built for a world that no longer exists. Earned Value Management was developed to link cost and schedule for objective progress measurement. It brought rigor and standardization to government contracting and remains valuable for traceability and accountability. However, its structure, which depends on static baselines, manual data reconciliation, and retrospective reporting, cannot keep pace with the digital, iterative nature of modern programs.
In an Agile or model-based environment, fixed baselines are obsolete as soon as they are approved. Each design change or software iteration triggers re-baselining overhead that delays responsiveness. Reports generated weeks later describe what happened rather than what is about to occur. Variance metrics identify deviation but not causality. Compliance reviews focus on data completeness rather than performance insight. IPM 2.0 transforms this paradigm. It replaces control accounts with living capability threads that evolve with the design. These threads maintain full cost, schedule, and technical traceability but do not require re-baselining to stay aligned. Figure 3 shows the data lineage within the Unified Performance Ledger provides continuity and accountability without administrative burden. In effect, the program baseline becomes a dynamic, continuously updated model rather than a static snapshot.
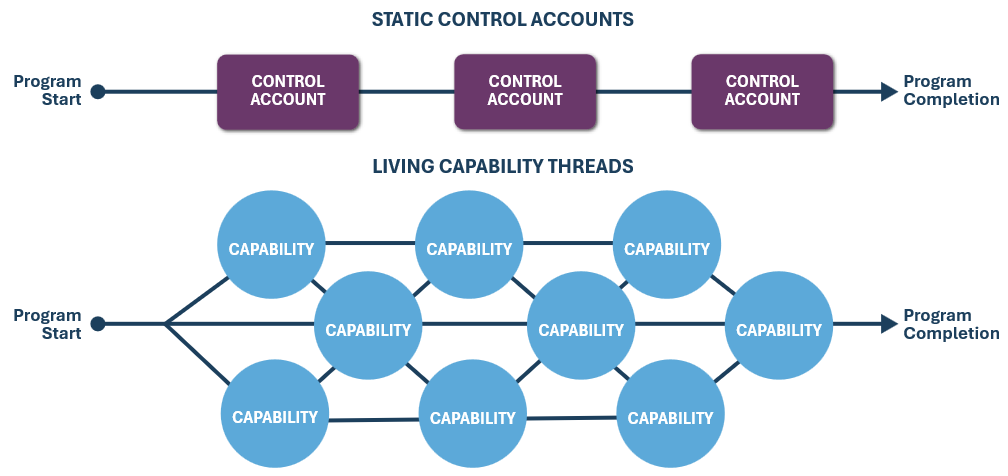
Figure 3: From Static Control Accounts to Living Capability Threads.
This approach converts performance management from audit to analysis, from periodic evaluation to continuous learning.
5. The Intelligence Core: Predicting What Happens Before It Happens
Modern programs cannot operate reactively, and the Analytics & AI Engine (AAE) ensures that emerging risks are detected and addressed before they become surprises. The Analytics & AI Engine is the intelligence core of IPM 2.0 (see Figure 1). It transforms the integrated data of the Unified Performance Ledger into foresight through advanced analytics, machine learning, and probabilistic modeling. The Analytics & AI Engine continuously detects anomalies, projects outcomes, and identifies emerging risks before they manifest.
Its purpose is not simply to automate reporting but to convert raw data into operational intelligence that enables faster and better decisions. By integrating engineering, schedule, and cost data into one analytical environment. The Analytics & AI Engine generates predictive insight that informs both tactical and strategic action.
Operating across multiple time horizons, the Analytics & AI Engine delivers a tiered view of performance. Near term analytics identify daily or weekly execution variances. Mid-range forecasts evaluate milestone achievement and expenditure trends. Long range simulations model tradeoffs and sensitivity scenarios for executive planning.
To achieve this, the Analytics & AI Engine performs four primary functions, summarized in Figure 4.
| Function | Purpose | Executive Value |
|---|---|---|
| Forecasting | Predict outcomes | Enables proactive correction |
| Anomaly Detection | Detects weak signals | Prevents emerging risk |
| Scenario Modeling | Evaluates options | Informs trade-offs |
| Prescriptive Guidance | Suggests mitigation paths | Converts insight into action |
Figure 4: Core functions of the Analytics and AI Engine.
Each function contributes to a closed loop performance intelligence system. Forecasting uses probabilistic models to anticipate cost, schedule, and technical outcomes. Anomaly detection scans across data layers to identify deviations or early signals of future risk. Scenario modeling enables decision makers to explore tradeoffs between scope, resources, and timing. Prescriptive guidance translates analytical insight into recommended actions that can be implemented and tracked within the Collaborative Decision Boards.
The Analytics & AI Engine operates within a transparent, traceable architecture. Every prediction includes an explanation of the data sources, confidence intervals, and reasoning path, ensuring that program leaders trust both the insight and its origin (see Figure 5). Bayesian updating refines accuracy as new data arrives, while adaptive learning enables the models to evolve alongside the program. Unlike traditional descriptive and lagging analytics, these methods are diagnostic, predictive, and prescriptive. Insights flow directly into the Collaborative Decision Boards, where cross functional teams implement mitigation strategies collaboratively. Over time, this creates a learning ecosystem where each decision strengthens future predictions.

Figure 5: Analytics & AI Engine performs four primary functions.
6. Replacing Reporting with a True Decision Engine
The biggest delay in program execution is not technical; it is decision latency. Data and analytics have no value unless they drive action. The Collaborative Decision Board is the operational brain of IPM 2.0, converting live insights into coordinated decisions. It brings together cross functional leaders from engineering, scheduling, financial, and program management disciplines within a unified digital workspace that replaces fragmented reviews with real time collaboration.
Traditional review cycles are too slow, too sequential, and too reactive. Decisions often occur weeks after the data that justify them, and insights are diluted through multiple handoffs. The Collaborative Decision Board eliminates these inefficiencies by creating decision simultaneity, a structure where every stakeholder views the same data, interprets it through their own lens, and acts together based on a shared understanding.
The purpose of the Collaborative Decision Board is to solve three enduring problems (see Figure 6). It removes time lag by replacing monthly variance reports with weekly or daily visibility. It eliminates information fragmentation by synchronizing all perspectives into a single decision environment. It overcomes action inertia by replacing sequential reporting chains with integrated, collaborative response. The Collaborative Decision Board is not a meeting, it is a decision engine where data, analysis, and action converge.
| Principle | Description | Benefit |
|---|---|---|
| Data Integrity | Operates from the single truth of the Unified Performance Ledger | Eliminates disputes and reconciliation overhead |
| Predictive Insight | Driven by Analytics and AI Engine outputs and foresight analytics | Enables anticipation rather than reaction |
| Shared Accountability | Decisions made collaboratively by cross domain leaders | Improves coordination and collective ownership |
| Continuous Feedback | Decisions loop back into the Analytics and AI Engine and Unified Performance Ledger for model refinement | Institutionalizes learning and continuous improvement |
Figure 6: Core principles of Collaborative Decision Boards
In operation, the Collaborative Decision Board synchronizes the technical, schedule, and cost perspectives into a single operational picture. It draws on live data from the Unified Performance Ledger and predictive analytics from the Analytics and AI Engine to support collaborative forecasting and early risk mitigation. Its purpose is to accelerate decisions, integrate disciplines, and enable proactive adaptation while maintaining full traceability from data to decision to outcome.
As shown in Figure 7, the Collaborative Decision Board executes through a five step Decision Intelligence Cycle that embeds learning directly into the program rhythm. The Analytics & AI Engine detects anomalies and emerging risks. Stakeholders diagnose root causes using correlated data across technical, schedule, and cost dimensions.
| Day | Activity | System Involved | Output |
|---|---|---|---|
| Monday | Data Integration and Refresh | Digital Data Fabric to Unified Performance Ledger | Unified performance snapshot |
| Tuesday | Predictive Analysis | Analytics and AI Engine | Updated forecasts and anomaly alerts |
| Wednesday | Pre Decision Preparation | Collaborative Decision Board Workspace | Decision candidates and trade scenarios |
| Thursday | Collaborative Decision Session | Unified Performance Ledger, Analytics and AI Engine, Dashboards | Approved actions and mitigations |
| Friday | Outcome Review and Model Update | Unified Performance Ledger, Analytics and AI Engine | Lessons captured and models refined |
Figure 7: The five-day decision cycle.
The team defined in Figure 8 decides on the optimal course of action by real-time modeling tradeoffs and evaluating predicted impacts. Approved actions are deployed and recorded within the Unified Performance Ledger, ensuring traceability. Finally, teams learn by comparing actual outcomes against predictions, refining both models and behaviors. Each decision becomes new data, and every iteration strengthens predictive accuracy and decision quality.
| Role | Core Function | Decision Contribution |
Example of Questions Answered |
|---|---|---|---|
| Advises on performance impact | |||
| Scheduler or Agile Lead | Manages sequencing and delivery rhythm | Quantifies timing elasticity | If we move this milestone, what impact cascades across dependent activities? |
| Financial Analyst | Tracks funding, cost, and value efficiency | Links budget and performance | What are the cost implications of accelerating integration or adding capability? |
| Risk Manager | Evaluates cross domain exposure | Quantifies probability and impact | Which risk presents the highest cost to capability effect? |
| Program Manager | Synthesizes technical, schedule, and financial insights | Balances tradeoffs to advance mission value | Which decision best advances mission outcomes under current constraints? |
| Executive or Customer | Observes, validates, and aligns expectations | Builds transparency and trust | Does the data support this decision as credible and defensible? |
Figure 8: Composition and functional roles within a Collaborative Decision Board.
The Collaborative Decision Board functions as a collaboration cell rather than a hierarchy. Each participant interacts with live Unified Performance Ledger data and Analytics & AI Engine forecasts within a shared digital workspace.
Each cycle concludes with a Decision Digest recorded in the Unified Performance Ledger, capturing the decisions made, rationale, supporting data, outcomes, and confidence scores for future reference. Over time, these digests form an institutional memory that supports enterprise learning and predictive improvement. Rhythm is the operating system of IPM 2.0. The Collaborative Decision Board is its heartbeat, and the Unified Performance Ledger is its pulse. Together they convert integrated data into coordinated action, ensuring that programs no longer wait for understanding but decide, learn, and adapt continuously.
7. From Report Generators to Insight Interpreters
IPM 2.0 changes roles more than tools: people stop reporting the past and start shaping the future. IPM 2.0 fundamentally changes how program teams operate. Instead of acting as data collectors or compliance reporters, personnel become interpreters of insight and enablers of decisions (see Figure 9). The workforce evolves from specialized silos into a network of digitally fluent professionals who share a common operational picture. Integration replaces translation. The organization no longer needs intermediaries to explain data; every role accesses relevant, validated information through the Collaborative Decision Board. Engineers see technical performance in context with schedule predictability and financial impact. Analysts understand how resource allocations affect design progress. Executives visualize program health through dynamic indices rather than static reports.
| Role | Decision Need | Insight Delivered |
|---|---|---|
| Technical Lead | Engineering feasibility | Capability Readiness Index (CRI) |
| Scheduler or Agile Lead | Timing predictability | Schedule Execution Index (SEIx) |
| Financial Analyst | Resource efficiency | Value Efficiency Ratio (VER) |
| Program Manager | Tradeoffs and balance | Integrated Performance Index (IPI) |
| Executive or Customer | Confidence and impact | Forecast Confidence Index (FCI) |
Figure 9: Shared Insight Model.
8. Stop Measuring Compliance. Start Measuring Readiness.
If you measure the past, you will always manage too late. Success in modern programs is no longer defined by adherence to a static plan but by effectiveness, adaptability, and mission impact. IPM 2.0 establishes a new standard for measurement that links technical maturity, schedule predictability, and cost efficiency into a unified performance architecture. Traditional metrics such as CPI, SPI, and TPMs remain valuable, but they evolve from compliance indicators into predictive signals. In this model, as depicted in Figure 10, performance is not an audit of the past; it is a forecast of readiness for the future.
| Focus | Legacy Approach | IPM 2.0 Approach |
|---|---|---|
| Orientation | Compliance and variance tracking | Insight and adaptability |
| Data | Monthly static reporting | Continuous integration via Unified Performance Ledger |
| Purpose | Satisfy oversight | Enable foresight |
| Action | Reactive correction | Proactive adaptation |
Figure 10: From compliance to comprehension.
Modern measurement must capture three simultaneous realities: technical readiness, schedule predictability, and value efficiency. These realities are integrated within the Unified Performance Ledger, which aggregates validated data across all domains. The Analytics and AI Engine processes these streams to generate leading indicators that predict outcomes rather than simply report variances. The goal is comprehension, ensuring leaders understand not just what happened, but why it happened and what must be done next.
Traditional metrics measure whether work was completed; modern metrics measure whether capability is emerging at the pace required for mission success. Each index within IPM 2.0 provides a multidimensional view of program health and includes predictive behavior based on historical patterns, digital engineering indicators, and real-time data integration. This transformation marks a fundamental shift from measurement as oversight to measurement as intelligence.
Together, these indices form the Integrated Performance Index, a single, dynamic measure of program health that captures progress, predictability, and value simultaneously. The Integrated Performance Index is not a compliance score; it is a living indicator of adaptability, forecast accuracy, and mission alignment.
The Three Predictive Indices are:
1. Capability Readiness Index (CRI)
CRI quantifies technical maturity, functional completeness, integration readiness, and mission relevance. It aggregates data from model-based systems engineering (MBSE), digital engineering artifacts, verification events, defect burn-down, configuration maturity, and subsystem-to-system interaction trends. Its predictive power lies in identifying technical trajectories before they become schedule or cost issues. CRI can detect:
- Growing defect-clusters before integration failure
- Design volatility that will drive rework
- Maturity shortfalls that threaten test readiness
- Subsystem misalignment that increases integration risk
CRI does not simply show whether technical performance is improving, it indicates whether the system is maturing at the rate needed to support the planned schedule and cost profile.
2. Schedule Execution Index (SEIx)
SEIx measures delivery rhythm, milestone stability, iteration predictability, and cross-team synchronization. Unlike SPI, which evaluates historical earned value, SEIx evaluates the pattern, reliability, and drivers of future execution. Its predictive value comes from identifying timing disruptions before they appear as schedule slips.
SEIx assesses:
- Cadence reliability across Agile teams or hardware workstreams
- Lead time variation and cycle-time instability
- Dependency risks that could trigger cascading delays
- Scenario forecasts that show likely milestone outcomes
By analyzing historical cadence trends and the current velocity of engineering progress, SEIx forecasts the likelihood of schedule adherence weeks or months before traditional metrics detect issues.
3. Value Efficiency Ratio (VER)
VER measures how effectively funding converts into capability, adjusted for risk exposure and technical maturity. It integrates expenditure data with engineering output, schedule health, and forecast confidence to reveal whether dollars are buying meaningful progress. Its predictive value lies in identifying cost inefficiency before budgets are consumed. VER evaluates:
- The marginal cost of achieving each additional unit of readiness
- Emerging inefficiencies associated with rework or instability
- The financial impact of technical variability
- Cost-to-capability projections across alternative scenarios
VER transforms cost management from accounting to intelligence, showing whether investment is producing mission value. The three performance dimensions fuse through the Integrated Performance Index, expressed as:
IPI = (wT × T) + (wS × S) + (wC × C)
where:
T = Capability Readiness Index (CRI)
S = Schedule Execution Index (SEIx)
C = Value Efficiency Ratio (VER)
and wT, wS, and wC are dynamic weights that shift with program phase.
As programs progress the balance changes among technical maturity, schedule execution, and value efficiency. The weighting structure adapts to these shifting priorities:
- Early Development Technical maturity, CRI, carries greatest weight.
- Integration and Test Schedule stability, SEIx, becomes dominant.
- Production or Sustainment Cost efficiency, VER, becomes primary.
Figure 11 summarizes the three dimensions of performance insights and how the integration of this data transforms metrics into a continuous decision intelligence system. IPM 2.0 ensures that measurement serves its true purpose, which is to guide action and improve outcomes.
| Domain | Traditional Metric | Outcome Metric | Description |
|---|---|---|---|
| Technical | Technical Performance Measures (TPMs) | Capability Readiness Index (CRI) | Quantifies maturity and functionality against mission outcomes; integrates model data, defect burn down, and verification trends. |
| Schedule | Schedule Performance Index (SPI) | Schedule Execution Index (SEIx) | Measures cadence reliability and iteration stability using predictive analytics from the Analytics and AI Engine. |
| Cost | Cost Performance Index (CPI) | Value Efficiency Ratio (VER) | Assesses how effectively funding converts into capability, adjusted for risk exposure. |
Figure 11: The three dimensions of performance insight.
Every index and confidence score is recorded in the Unified Performance Ledger and visualized in the Collaborative Decision Board workspace, creating a transparent, closed loop environment where measurement drives comprehension and comprehension drives intelligence (see Figure 12).
| Trend | Meaning | Recommended Action |
|---|---|---|
| Rising IPI | Program improving across domains | Reinforce current approach |
| Stable IPI | Balanced, predictable performance | Continue monitoring |
| Diverging indices, CRI up and SEIx down | Technical progress outrunning schedule | Re-sequence priorities |
| Diverging indices, VER down and CRI up | Cost inefficiency despite progress | Investigate rework or scope creep |
| Falling IPI | Compound degradation | Convene Collaborative Decision Board for rapid mitigation |
Figure 12: Interpreting Integrated Performance Index trends.
9. What Executives Must Do Now
Executives must lead the shift from oversight to performance intelligence. The transition to IPM 2.0 is not a technical upgrade, it is a leadership transformation. The success of this paradigm depends on how well executive teams align governance, investment, culture, and policy to enable continuous insight and adaptive decision-making. Executives must move from supervising compliance to governing performance intelligence, ensuring that data-driven foresight replaces retrospective oversight.
The following recommendations provide a structured roadmap for leadership to accelerate adoption, sustain momentum, and embed IPM 2.0 as a core enterprise capability transition from compliance to Business Intelligence (BI) Performance as shown in Figure 13.
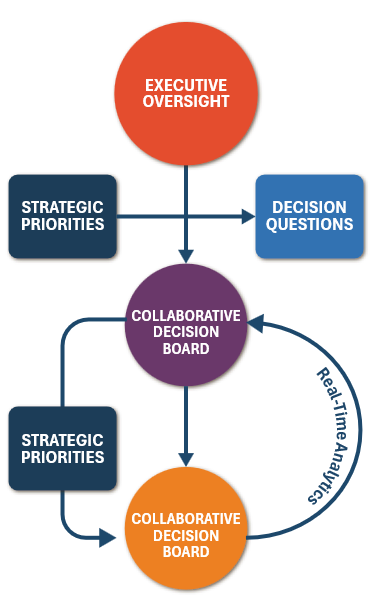
Figure 13: From Compliance to BI Performance.
Governance: From Compliance Reviews to Performance Intelligence. Traditional governance frameworks emphasize status reporting and after-action reviews. As shown in Figure 14, the IPM 2.0 model, oversight shifts toward digital performance governance, where decisions are based on real-time indicators rather than monthly variances. Executives should institutionalize governance through Continuous Performance Governance Boards (CPGBs) that monitor the Integrated Performance Index (IPI), Forecast Confidence Index (FCI), and leading indicators derived from the Analytics & AI Engine.
| Focus Area | Recommended Executive Action |
|---|---|
| Governance | Replace compliance reviews with digital performance reviews supported by real time dashboards |
| Investment | Fund Digital Data Fabric and Analytics and AI Engine platforms as core infrastructure |
| Talent | Upskill teams in data interpretation, analytics, and Agile metrics to transform reporting into decision enablement |
| Supplier Integration | Require digital data sharing standards via contract clauses to ensure transparency across primes and subs |
| Metrics | Adopt hybrid dashboards blending earned value, Agile, and technical KPIs within the Unified Performance Ledger |
| Culture | Promote collaboration across engineering, scheduling, and financial disciplines through Collaborative Decision Board participation |
Figure 14: Strategic actions for executive alignment.
Talent: Building a Data-Fluent Workforce. A successful IPM 2.0 implementation depends on a workforce that can interpret, not just collect data. Executives should focus on reskilling and upskilling initiatives that transform program control professionals into decision enablers. Key competencies include:
- Data literacy and model interpretation.
- Understanding AI-driven insights and predictive indicators.
- Cross-domain reasoning that connects engineering, finance, and operations.
- Effective use of collaborative platforms such as CDBs for decision-making.
This evolution eliminates the need for the Control Account Manager (CAM) role as a central interpreter. Instead, technical leads, analysts, and program managers directly access real-time insights tailored to their perspective. As a direct result, the organization becomes less hierarchical and more networked, operating as a shared intelligence ecosystem where each participant can interpret and act on integrated data.
Supplier and Partner Integration: Building a Transparent Ecosystem. Transparency must extend beyond the prime contractor to the full supply chain. Executives should ensure that digital data-sharing requirements are built into contracts, enabling subcontractors to feed data directly into the DDF and UPL via standardized APIs. This integration reduces latency, eliminates manual reconciliation, and creates a shared situational awareness across all tiers.
Partner integration should focus on alignment, not control. Rather than enforcing compliance through reporting templates, primes and government customers should align data accessibility, semantic consistency, and quality standards. When suppliers participate in the same integrated data environment, performance oversight evolves from inspection to collaboration.
Metrics: Blending Technical, Financial, and Predictive Indicators. Leadership must evolve the definition of performance. The Integrated Performance Index (IPI) should become the enterprise health metric, supported by its component indicators:
- Capability Readiness Index (CRI) for technical maturity.
- Schedule Execution Index (SEIx) for delivery rhythm.
- Value Efficiency Ratio (VER) for cost-effectiveness.
Executives should complement these with the Forecast Confidence Index (FCI) to quantify the reliability of projections and the Integrated Risk Adjustment (IRA) to contextualize risk exposure.
By using these metrics collectively, executives can anticipate trends before they materialize and deploy corrective actions proactively. Dashboards and visualization tools should focus on comparative trends, predictive risk maps, and leading indicators rather than static performance charts. The goal is to create a visual narrative that fosters understanding, not just compliance reporting.
Culture: Leading with Transparency and Collaboration. IPM 2.0 thrives in a culture that values openness, shared accountability, and continuous learning. Executives must model these behaviors by using data transparently in decision making and by encouraging cross-functional participation in CDBs. Decisions should be explained, outcomes should be shared, and lessons should feedback into the learning loop. This transparency builds trust, both within the organization and with customers and partners.
Executives must also recognize that cultural transformation is not a one-time initiative. It is sustained through reinforcement, consistency, and feedback. When leaders use IPM 2.0 insights to drive strategy discussions, resource allocation, and risk posture, they signal that the system is not just a reporting mechanism but a core decision platform, the operating system of the business.
From Oversight to Foresight. The shift to IPM 2.0 allows executives to move from reviewing history to shaping the future. Governance becomes a strategic function of insight rather than inspection, and leadership effectiveness is measured by decision velocity, forecast accuracy, and mission outcomes. Executives who embrace this transformation position their organizations to compete and succeed in an environment that demands both agility and accountability.
10. Conclusion: Toward Performance Intelligence
Program Controls is no longer about reporting the past; it is about predicting and shaping the future. IPM 2.0 transforms traditional program control into performance intelligence, the connective tissue between tech¬nical progress, financial accountability, and mission success.
Through the Digital Data Fabric, data becomes seamless. Through the Unified Performance Ledger, it becomes trusted. Through the Analytics & AI Engine, it becomes predictive. Through the Collaborative Decision Boards, it becomes actionable. Through the Integrated Performance Index, it becomes measurable and actionable intelligence. Together, they form a continuous-learning ecosystem that senses change, anticipates risk, and empowers faster, more confident decisions (see Figure 15).

Figure 15: End to End Data to Decision Ecosystem.
This is not the erosion of discipline but the modernization of it. By replacing compliance driven reporting with integrated decision support, IPM 2.0 delivers rigor through transparency, agility through data, and mission performance through intelligence. The future of program management is not about how well we account for performance. It is about how intelligently we improve it.
A. References
- DOW Acquisition Transformation Strategy Memo (2025)
- DOW Transforming the Warfighting Acquisition System Memo (2025)
- DoDI 5000.85 – Major Capability Acquisition (2020)
- DoD Instruction 5000.02 – Operation of the Adaptive Acquisition Framework
- NDIA IPMD – EVM and Integrated Program Management Guide (2022)
- OUSD CAPE – EVM Policy Reform Updates (2023)
- DoD Software Modernization Strategy (2022)
- Scrum.org – Evidence Based Management Guide
Download this article as a PDF: IMP 2.0: Revolutionizing Program Controls for DOD Acquisition Reform (0 downloads )
 |
Jacque Keats, CF APMP, is SMA’s Chief Operations Officer and is a recognized industry expert in the field of system integration for project management, with over 30 years of experience developing and implementing award winning scheduling, resource planning, costing, and enterprise project management systems for fortune 500 companies and government agencies. |
Posted on November 24, 2025, by
Dick Eassom, CF APMP Fellow, SMA, Inc.


