

13 minute read
Image: SMA Creative Department
June 24, 2026
PTW Done Right
In major government competitions, companies rarely lose because they cannot build a price model. They lose because they price their offer against the wrong view of the competition.
That mistake is more common than many executives realize. In too many pursuits, “price to win” (PTW) is treated as a one-dimensional exercise: estimate where the market will clear, decide how much room exists to cut, and then force the bid into that number. That logic can be useful in lowest-price-technically-acceptable environments, where offering acceptability is the gate and price is the deciding factor. But it is a poor guide in the competitions that matter most—large, strategic best-value procurements, where the customer is explicitly evaluating a mix of technical merit, performance risk, delivery confidence, past performance, and price. In those environments, the winning question is not “What price do we need?” It is “What offer will produce the best evaluated position?”
Scroll down to keep reading,
or download a PDF of this white paper here:
PTW Done Right
That distinction is not academic. In the United States Government Accountability Office (GAO) study that underpinned our earlier paper, the Department of Defense (DoD) used best-value processes for roughly 95% of new, competitively awarded contracts with at least $25 million obligated, and 47% used a tradeoff approach in which non-cost factors, combined, were more important than price. GAO also found that tradeoff decisions were used when the government cared about issues such as technical understanding, schedule, and proven performance—not simply price minimization.
That is why traditional price-to-win analysis, which focuses only on price, misses the mark. It isolates price when the customer does not. Our prior paper, What Actually Drives Best-Value Decisions: The Myth of the 10% Rule, made that point directly. Similar price premiums can lead to very different outcomes because the government is not applying a rule of thumb; it is making a comparative value judgment under the stated evaluation criteria. A premium is accepted when the underlying advantage is meaningful and relevant. It is rejected when the advantage is marginal, uncertain, or insufficiently tied to mission outcomes. That is why best-value decisions do not follow a fixed threshold. They follow a value comparison.
Once that is understood, the right role of price-to-win becomes clear. In a best-value competition, PTW should not be treated as a standalone pricing exercise. It should be treated as the output of a rigorous competitive assessment. The goal is not merely to estimate the lowest plausible winning bid. The goal is to understand how the customer will score competing offers and then determine what price and non-price combination gives your team the strongest total evaluated position. That is what we mean by a Total Evaluated Score, or TES, approach.
This is also where many capture teams go astray. They start with internal cost pressure or a rough market benchmark and only later ask whether the solution is actually strong enough to support that price. In a best-value environment, the sequence has to run the other way. The starting point is the customer’s evaluation structure. What exactly is being evaluated? Which technical outcomes matter most? How are past performance, management approach, staffing, risk, and schedule weighted? How much relative emphasis is placed on price? GAO’s review makes clear that tradeoff procurements are defined by the solicitation’s weighting of price and non-price factors and by the source selection authority’s comparative assessment of perceived benefits versus added cost.
From there, the hard work begins: Developing a real hypothesis about the competitors. That means more than labeling one rival as a “technical player” and another as a “price player.” It requires a disciplined assessment of what each serious bidder is likely to offer, how that offer will perform against the evaluation criteria, what it will cost to deliver, and how that bidder is likely to price given its incentives, constraints, and strategy. The analysis scores each hypothesized offering across all of the non-price factors and sub-factors, converts the adjectival ratings into quantitative scores, then weighs each of these based on the evaluation criteria that describes the relative importance of each. In other words, a serious PTW analysis has to estimate both halves of the equation: non-price standing and price standing. Anything less is incomplete.
Bringing Together Price and Non-Price Factors
This is where the TES framework becomes powerful. The SMA PTW chart makes that price/non-price trade space visible. In Figure 1, the horizontal axis represents non-price score, and the vertical axis represents evaluated price. We plot a bid on this graph, where the horizontal placement is based on the non-price evaluation of the offering, and the vertical placement is based on the bid price. In this case, the non-price score is 85% of maximum, and the bid price is $250M. In best value tradeoff, better offerings can justify a higher price, meaning there are points above and to the right of our notional bid that would receive the same score, just as points below and to the left (lower price, weaker offerings) can also have the same score. The tradeoff is quantified with the evaluation criteria described in the solicitation, where the relative weighting of price and non-price factors give the steepness of the “isocurve,” or the curve of constant TES.
Figure 1. The Price to Win chart with price and non-price axes. This chart shows a bid, and the curve of constant total evaluated score (isocurve), along with curves representing higher and lower scores.
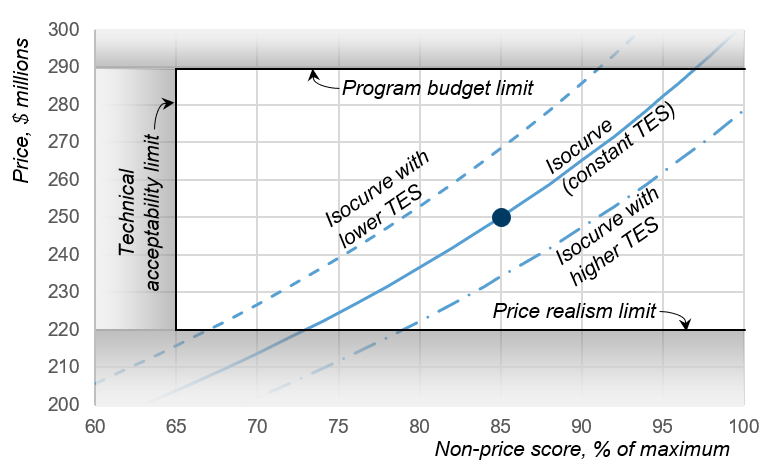 The isocurves show the central fact of every best-value procurement: a bidder with a stronger non-price position can sustain a higher price and still remain equally competitive, while a bidder with a weaker non-price position must compensate through lower price. On the figure we also show isocurves representing higher and lower TES. That is, the curve to the right represents bids with a higher non-price score for a given price, and the curve to the left is lower non-price scores.
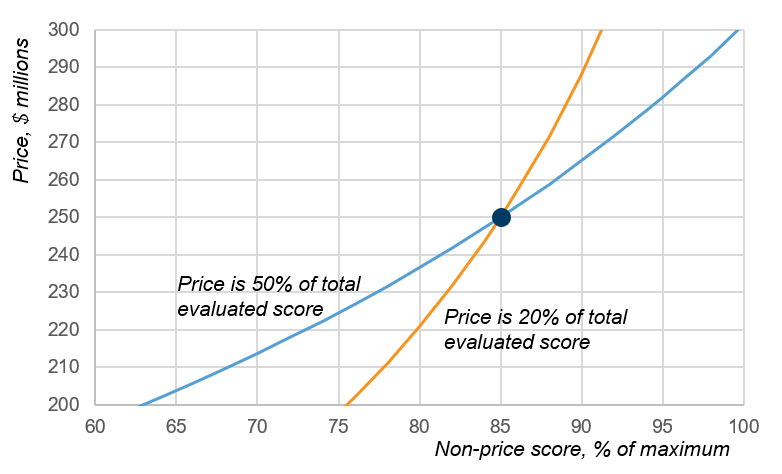
For different weighting of price and non-price, the curves take different shape. In Figure 2, we add a second isocurve going through the notional bid. The first curve is based on price being 50% of the total score, or price and non-price have equal weighting. The new curve is based on price having 20% weighting, with non-price factors being much more important. The second curve is substantially steeper, which is what we would expect. That means that with price having less weight, there would have to be a more substantial change in price to offset moderate increments in non-price score changes to result in the same TES.
Figure 2. Different weighting between price and non-price in the evaluation. The same bid has different isocurves based on different evaluation criteria.
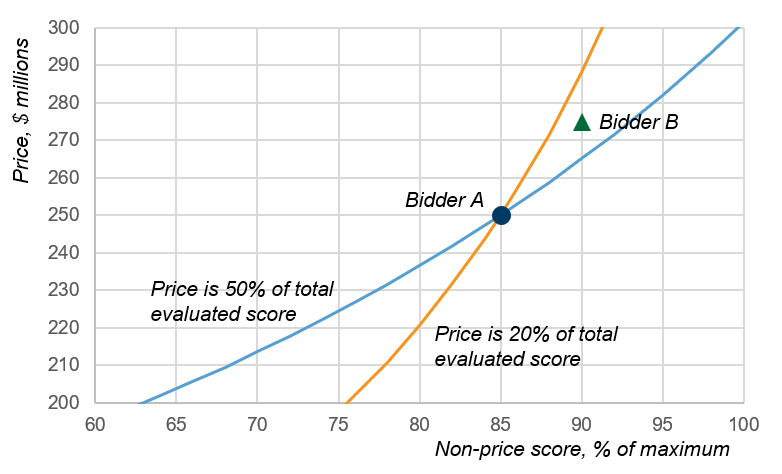
Now when we add competitor B’s bid to the graph, as shown in Figure 3, it gets interesting. The bid is evaluated to have a 90% non-price score, and a bid price of $275M. It is more expensive than A’s bid, but also has a higher non-price score. Is this bid considered to have a higher, lower, or similar value compared to A? With the original evaluation weighting of price being 50% of the total score, B’s bid is to the left of A’s isocurve, meaning B earns a lower TES and is a lower value offer. However, in the second scenario for the evaluation where non-price increases from 50% to 70% of the weighting, representing the steeper isocurve, B’s bid is to the right of A’s isocurve, indicating a higher value bid.
Figure 3. Depending on the relative weighting of price in the TES, bidder B’s higher rated and higher priced offering can have a higher or lower TES.
Determining the Winning Bid
Let’s go back to the situation where price and non-price have equal weighting, as shown in Figure 4, An effective PTW analysis needs to determine where competitors will lie on the graph. A comprehensive competitive analysis develops a point of view about each competitor’s bid. This includes details about the offering to assess the technical score, program management, past performance, and other non-price factors, and then quantitatively assessing them according to their relative importance to come up with a non-price score.
Figure 4: Isocurves are used to determine the leading competitor, and how a bidder must formulate their offer to achieve the highest TES with appropriate margin for error.
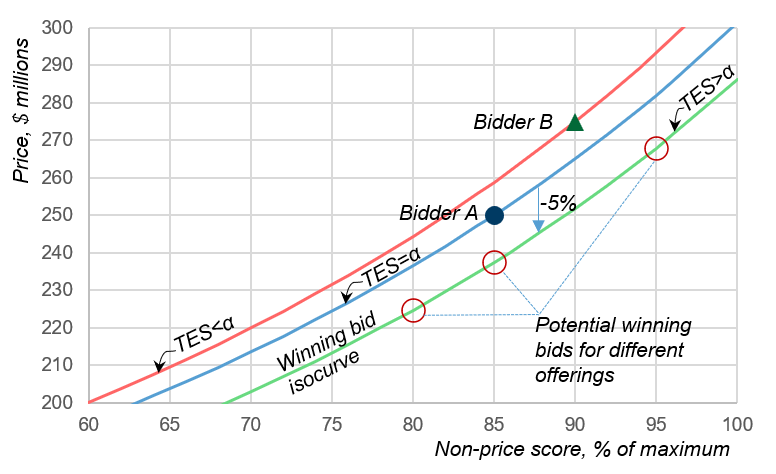
The PTW analysis then determines the price associated with each bid to place the bid on the two-dimensional graph. Because these different bids create a scatter on graph, it’s not always apparent by eye which bid is the strongest one—the bid to beat. As we did in Figure 3, the bids are compared based on their TES. Figure 4 shows two competitor bids, each with their isocurve. From this, competitor A is the leading threat, as that isocurve is furthest to the right.
To determine the winning bid for a third bidder, we introduce a TES-to-win line that assumes a 5% advantage in unweighted price score over a competitor at the same non-price score. That visualization turns an abstract tradeoff into something executives can actually use. We used 5% for illustrative purposes. Companies must assess their own risk appetite and pick an appropriate price advantage when competing against others likely to score equivalently on non-price factors.
To use this curve, we must assess our likely non-price score, and then read off the corresponding price. That is, if our offer is expected to have a non-price score that is 80% of available points, then the corresponding price would be approximately $225M. A non-price score of 95% could price at $268M and be on the same winning isocurve.
That is the important difference between a conventional PTW view and a TES view. Conventional PTW asks, “Where do we need to price?” TES asks, “What evaluated position do we need to create?” The first tends to compress the problem into a single number. The second forces a management team to confront the real trade space between solution strength, execution risk, and price. It shows whether a proposed enhancement actually creates customer value under the evaluation criteria, and it shows whether a pro-posed cost reduction helps or hurts the overall position.
That matters because the most important decisions in a pursuit are rarely purely pricing decisions. They are bid-shaping decisions. Should the team invest in an enhanced technical approach that improves mission performance but adds cost? Should it accept a lower-cost delivery construct that introduces schedule risk? Should it price aggressively to take perceived premium risk off the table, or does the offer have enough differentiated value to support a higher price? A TES-based PTW analysis helps answer those questions in the language that matters most: customer value as reflected in the evaluation scheme. If the added cost of an enhancement is not sup-ported by enough evaluated benefit, it is not creating value for the customer. If a price reduction comes with non-price degradation that erodes more score than it saves, it is not improving competitiveness.
The importance of this discipline becomes even clearer when viewed against actual best-value out-comes. Our prior paper showed that many competitions do not even end in a true tradeoff. A large share resolve through what we called dominant outcomes—one proposal is both higher rated and lower priced. In the remaining cases, the government sometimes pays the premium and sometimes rejects it. The same nominal price band can support different outcomes because the decision turns on the quality and relevance of the non-price advantage, not on an informal percentage rule. The lesson is simple: companies should not manage to a perceived “safe” premium window. They should manage to a superior evaluated position.
Making the PTW Analysis Useful
The multiple evaluation factors typical in best value competitions make it complicated to determine the TES. That is why rigorous competitive assessment is indispensable. A TES model is only as good as the competitive hypotheses inside it. If a team misreads a competitor’s likely offering, overestimates its own discriminators, or underestimates the customer’s price elasticity created by the evaluation weights, the resulting PTW guidance will be wrong—sometimes dangerously so. The analysis has to be rooted in detailed competitor intelligence, solution-level understanding, cost realism, and a clear point of view on how evaluators will actually interpret the differences between offers. This is not spreadsheet work alone. It is capture judgment, technical judgment, and pricing judgment combined.
It is also where executives need more than a pricing estimate. They need decision-quality insight. They need to know where the current offer sits in the price/ non-price trade space. They need to know which improvements are worth funding, which cost reductions are false economies, and which competitor scenarios truly threaten the pursuit. Most of all, they need to know whether the company is designing an offer that the customer will recognize as better value—or merely designing one that is cheaper. Those are not the same thing.
At SMA, this is the core of how we think about competitive assessment and price to win. We do not treat PTW as a narrow pricing exercise or a backward-looking market average. We treat it as a position-to-win problem. That means starting with the customer’s evaluation framework, developing a rigorous view of competitors’ likely offerings, estimating the non-price and price dimensions of those offers, and then using a TES-based model to identify the bid configuration most likely to prevail. It also means helping clients make the harder management decisions that flow from that analysis: where to differentiate, where to simplify, where to absorb cost, and where to hold price because the value is real and supportable.
This perspective also protects against two common and costly errors. The first is overpricing unsupported value: assuming that because the team likes its own solution, the customer will pay for it. The second is underpricing real value: compressing price to avoid perceived risk and leaving margin on the table even when the offer establishes a strong, defensible advantage. A sound TES-based approach helps teams avoid both traps because it keeps price anchored to competitive position, not internal optimism or market folklore.
The executive implication is clear. In best value competitions, price to win is not a number to discover late in the process. It is the product of a disciplined understanding of how value will be evaluated, how competitors are likely to show up, and how your own offer should be shaped in response. Done well, it informs pricing. Done properly, it informs strategy.
That is the real lesson beyond the myth of the 10% rule. Winning major government contracts is not about staying within a band. It is about creating an offer the customer will evaluate as the best overall value. In the competitions that matter most, the companies that win are not the ones with the cheapest bid. They are the ones with the clearest position to win.
 |
Ajay Patel, CF APMP, is SMA’s President and Chief Executive Officer, and has over 30 years of consulting, business development, operations, program management, and systems engineering experience. |
 |
Alan Berman is Vice President for Research and Strategic Initiatives at SMA: The Program Lifecycle Company, where he leads the firm’s research agenda and supports strategy, capture, and growth initiatives across the federal market. |
Posted on June 24, 2026, by
Dick Eassom, CF APMP Fellow, SMA, Inc.


