

19 minute read
Image: SMA Creative Department
April 24, 2026
The Myth of the 10% Rule—And What Actually Drives Best-Value Decisions
By Ajay Patel and Alan Berman
In Department of War best-value competitions, most teams operate with a familiar rule of thumb. Stay within roughly 10% of the next best offeror to win on technical strength, or price approximately 10% lower to offset a technical gap. In practice, many teams narrow that range even further and target a 5% window. Some view this as a more conservative application of the same logic, while others default to it because they do not believe they can differentiate in ways that justify a larger premium. In many cases, the decision reflects a desire to avoid losing on price rather than a clear understanding of how evaluators assess value.
This rule does not appear in policy, yet it shapes how teams build solutions, position value, and make pricing decisions. Over time, it takes on the appearance of a boundary condition, as if outcomes hinge on staying within a defined threshold. That assumption simplifies a complex decision into a single variable and, in doing so, drives behavior across the market.
Scroll down to keep reading,
or download a PDF of this white paper here:
What Actually Drives Best Value Decisions
Best-value competitions resolve in a limited number of ways:
-
- The government selects a higher-rated proposal and pays a price premium for the perceived added value.
- One proposal offers both higher technical merit and a lower price, resulting in a clear or “dominant” win that requires no tradeoff.
- The government rejects the price premium and selects the lower-priced offer over the higher-rated alternative.
These three outcomes provide a useful framework for understanding how best-value decisions are made and how different competitive positions translate into award decisions.
We set out to test whether the 10% Rule belief holds up under evidence. Our effort focused on a straightforward question: do best-value outcomes follow a consistent pricing threshold, or do they follow a different pattern? Answering that question is not simple because reliable data on best-value tradeoff decisions is difficult to obtain. Most source selection decisions do not disclose detailed evaluation results, and pricing information is rarely available in a structured form.
To address this challenge, we combined two complementary sources. The first draws on a GAO portfolio study conducted in 2009 [1] of 68 DoD best-value tradeoff procurements. This study remains one of the most thorough and authoritative analyses of best-value outcomes and provides the most reliable estimate of how frequently different types of decisions occur. The second draws on an expanded set of 38 GAO protest decisions spanning 2012 through 2026. SMA identifies these cases by systematically reviewing protest records to find instances where pricing and evaluation information were disclosed in sufficient detail to support analysis.[2]
Each source serves a different purpose. The GAO portfolio study provides an unbiased view of outcome frequency and serves as the baseline for understanding how often different types of decisions occur. Protest decisions, by contrast, represent a selectively revealed sample. Parties are more likely to protest cases with higher-priced winners and include detailed evaluation records, while clear dominant wins rarely prompt protests and remain underrepresented. As a result, analysts cannot rely on protest data alone to estimate how frequently different outcomes occur.
We therefore rely on the GAO portfolio study to establish the distribution of best-value outcomes, and use both datasets together to better understand the magnitude and role of price differentials in those decisions. The GAO study reports price differences for non-dominant cases, and the protest dataset adds detail on how evaluators assess and justify those differences in practice. Together, these sources create a dataset of 106 competitions that offers both scale and insight.
Distribution of Outcomes
Across the GAO study dataset of 68 competitions, winning bids fall into the three categories described above. For most best value competitions (43% of cases), the government selects a proposal that is both higher-rated and lower-priced, resulting in a dominant outcome. In 31% of cases, the government selects a higher-rated, higher-priced proposal and pays a premium. In the remaining 26% of cases, the government selects a lower-priced offer despite the presence of a higher-rated alternative. Figure 1 illustrates this distribution, showing how outcomes break across these three categories.
Figure 1. Distribution of Best Value Outcomes from the GAO Portfolio Study.
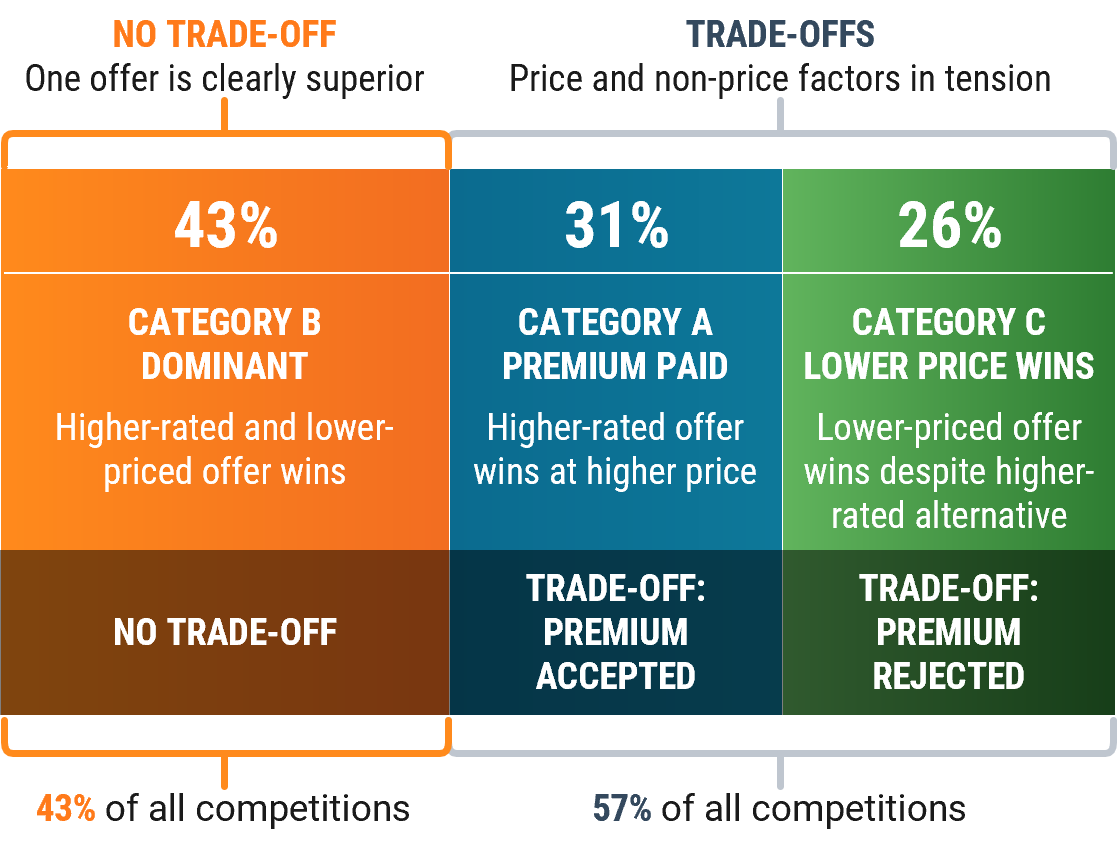
Two observations follow immediately from this distribution. First, the most common outcome in best-value competitions is not a tradeoff at all. In nearly half of all cases, one proposal outperforms the competition on both technical merit and price, removing the need for any tradeoff decision (Category B). Second, among the 57% of competitions that require a tradeoff between price and non-price factors (Categories A and C), outcomes split almost evenly between selecting the lower-priced offer and selecting the higher-rated proposal. Premium decisions occur frequently enough to matter, but they do not dominate outcomes.
This first point deserves emphasis because it runs counter to how many teams think about best value. In a large number of cases, evaluators face an easy decision. The highest non-price score comes with the lowest price, and the government receives the best of both worlds. The evaluation does not require balancing competing factors or justifying a premium. It simply confirms the superior position of one offer.
Many teams, however, assume that every competition will require a tradeoff. They design solutions and pricing strategies around managing that tradeoff, rather than asking whether they can eliminate it. The data suggests that, whenever feasible, the stronger objective is to create a position where they win on both dimensions.
At the same time, the competitions that require a tradeoff between price and non-price factors (Categories A and C) show that best value does not consistently favor the highest-rated proposal. In nearly half of competitions requiring a tradeoff the government selects a lower-priced offer even when a higher-rated alternative exists (Category C). These outcomes reflect situations where the perceived advantage of the higher-rated proposal does not justify the additional cost. The evaluation does not ignore technical differences. Instead, it reflects a judgment that those differences are limited, uncertain, or not strongly tied to mission outcomes. The evaluators decide that the differences do not warrant the higher price based on the customer’s weighting of price vs. non-price factors.
Several cases illustrate this dynamic clearly. In one competition, a higher-rated proposal carrying a substantial price premium was declined because the technical advantages did not align closely enough with program needs. In another, a 16.26% premium was explicitly rejected because the technical advantage was characterized as only “slight.” These decisions underscore a critical point. A higher technical rating does not guarantee a win. The advantage must be meaningful enough to justify the incremental price.
In the remaining tradeoff cases (Category A), evaluators reach the opposite conclusion and determine that the additional value of the higher-rated proposal justifies paying a premium. Taken together, these outcomes create a near-even split between premium-paid and price-driven decisions.
This balance reinforces an important point. Evaluators do not systematically favor either price or technical superiority. They perform the best-value evaluation substantively, weighing the relative importance of factors based on the specifics of the requirement and the stated evaluation criteria.
Price Differentials
The analysis that follows focuses on the subset of best-value outcomes in which the government selects a higher-rated, higher-priced proposal and pays a premium (Category A). These cases represent situations in which a tradeoff is made in favor of perceived additional value and provide the clearest view of how price differentials are evaluated. Understanding the magnitude of price premiums, therefore, requires focusing on this subset of decisions.
While the two datasets we used differ in structure, they can be combined to form a more complete view of price differentials. The GAO portfolio study provides the most reliable estimate of how frequently different premium ranges occur, while the protest dataset, though not representative in terms of frequency, provides greater resolution and captures the full range of observed outcomes. Figure 2 presents the distribution of price premiums paid and rejected.
Figure 2: Price Premiums Paid vs. Rejected in DoD Best-Value Tradeoffs.
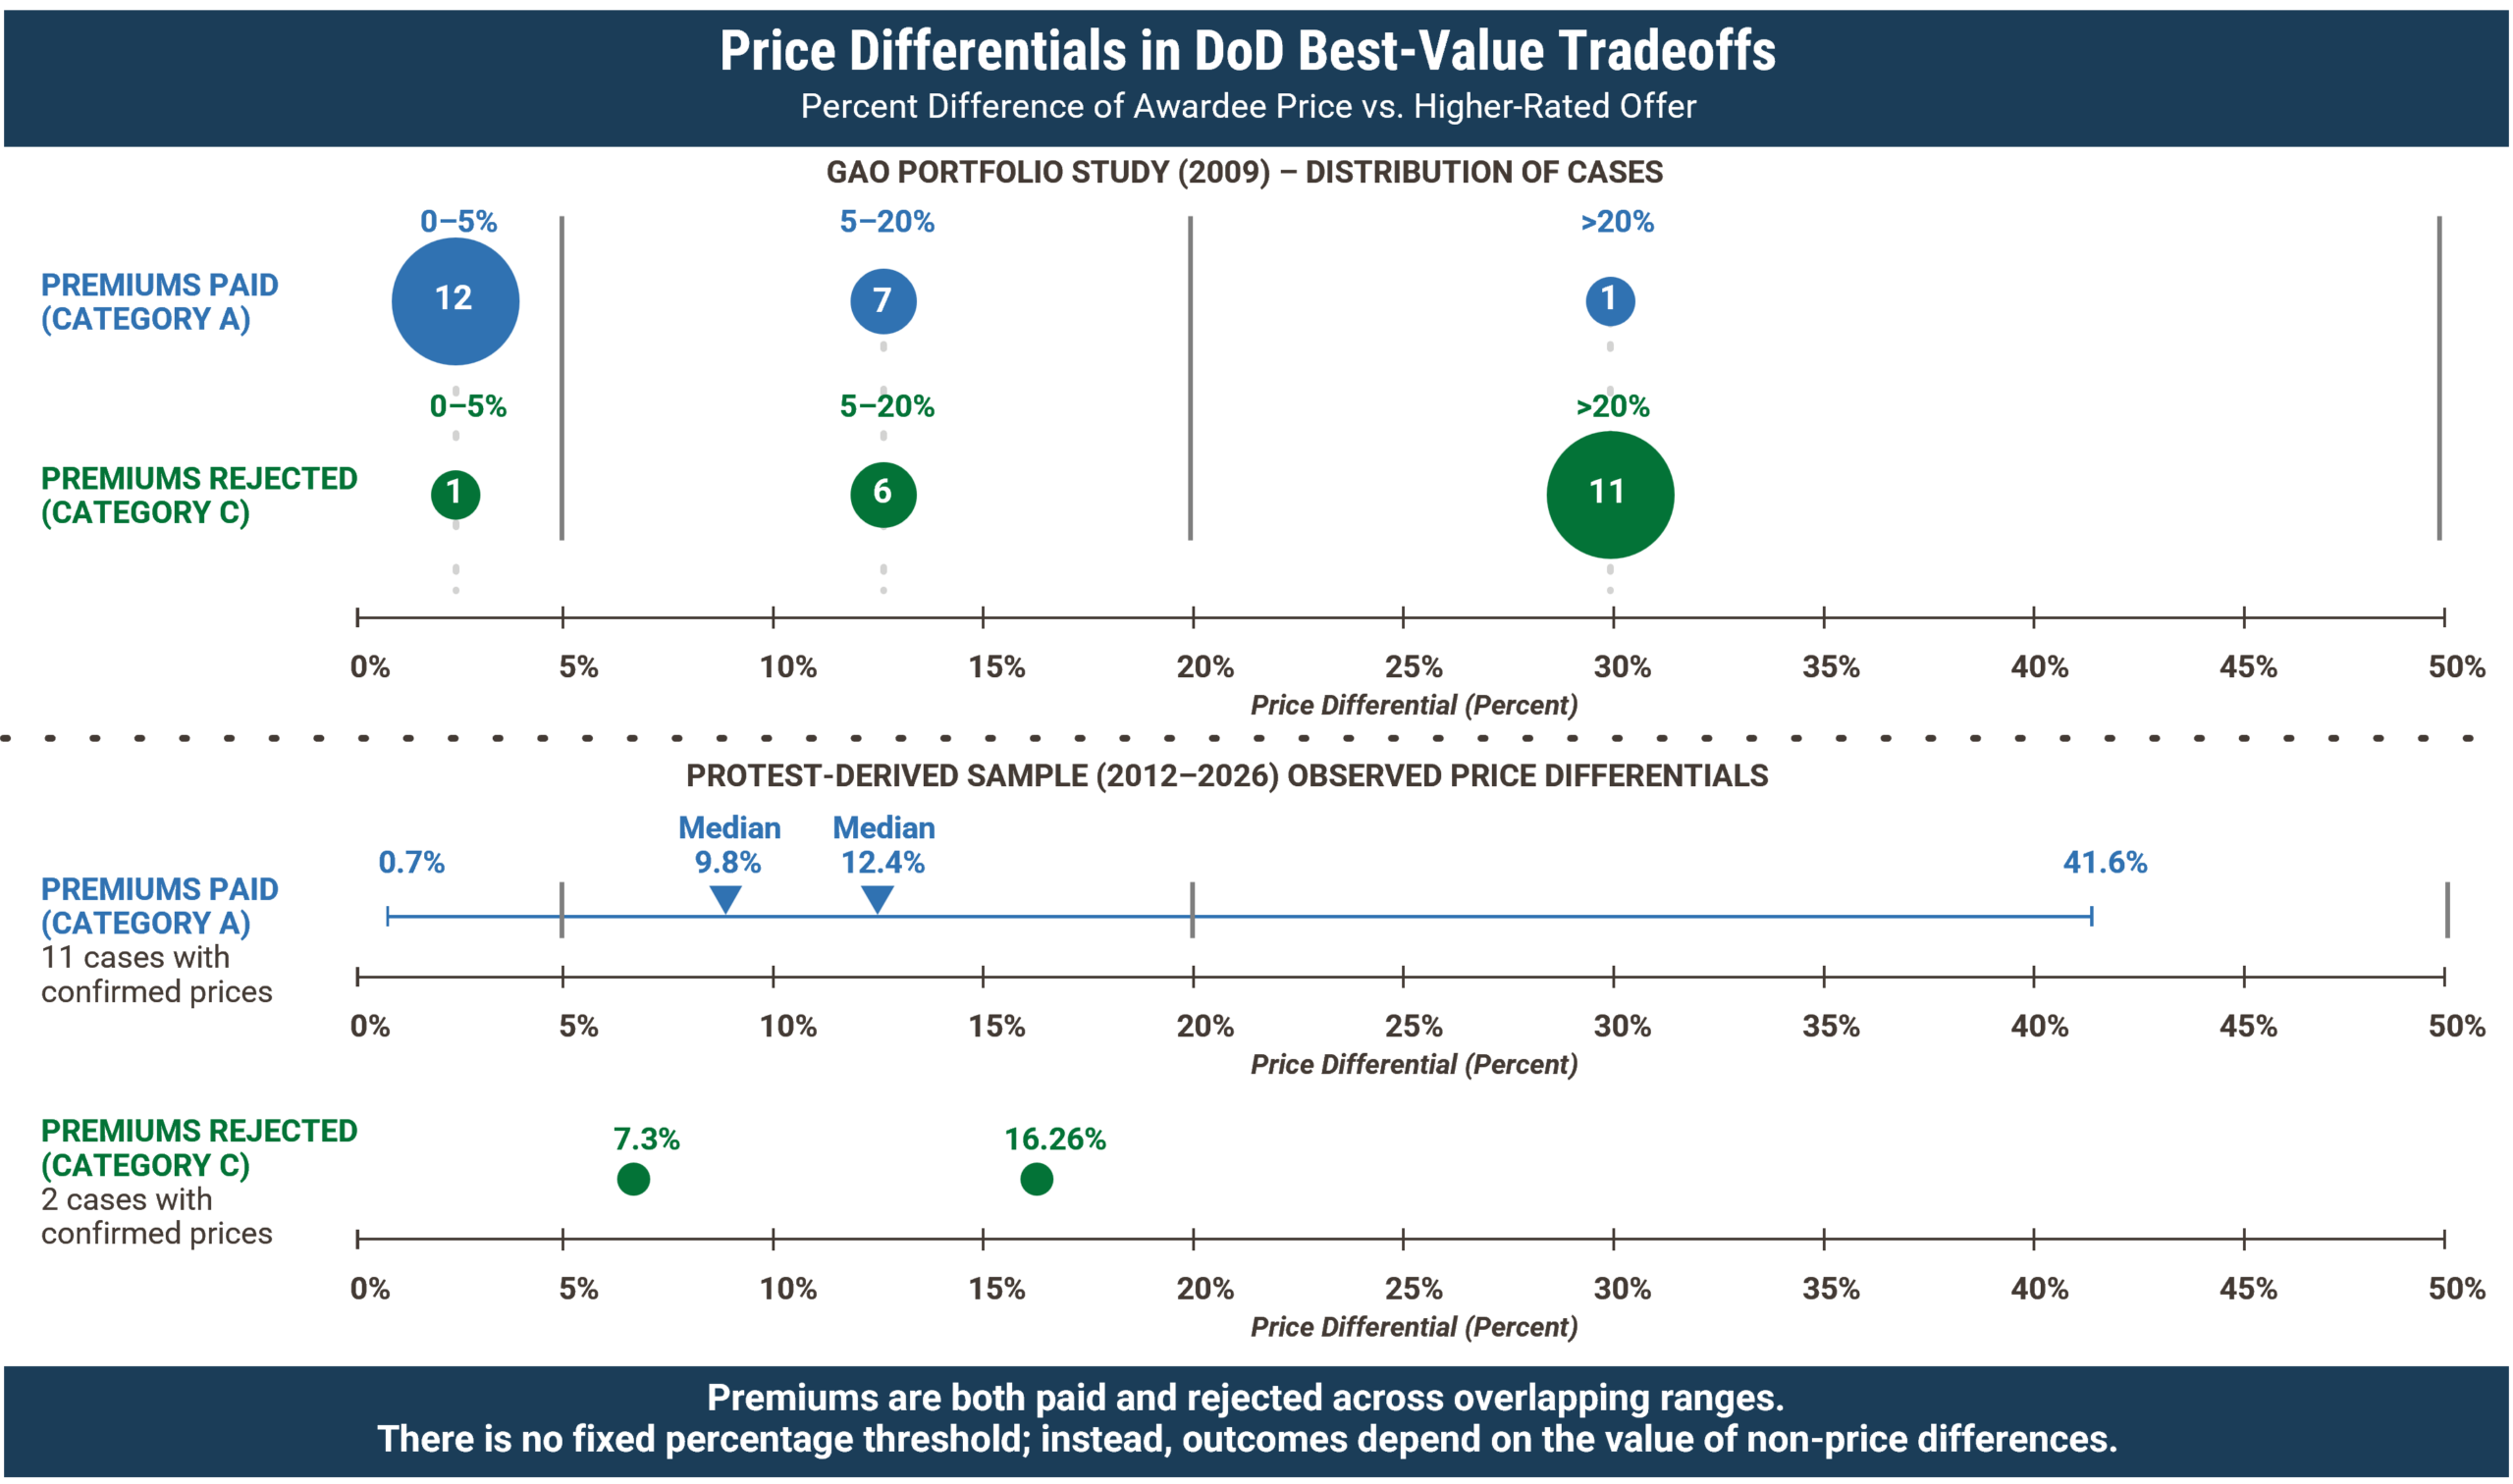
Across the GAO portfolio dataset, the government paid a premium in 21 of 68 cases. Of those, 12 premiums were 5% or less, seven fell between 5% and 20%, and two exceeded 20%. These results show that most paid premiums occur at relatively modest levels, with progressively fewer cases at higher percentages.
To better understand the magnitude of those premiums, we combine this distribution with a detailed sample of protest decisions where pricing was disclosed. When considered together, these sources indicate that the typical premium falls in the high single digits, with a central tendency of approximately 7 to 9%. At the same time, observed outcomes span a much wider range, from less than 1% to more than 40% premium.
This combined view establishes an important baseline. Many tradeoff decisions occur within a relatively narrow band, but the distribution extends well beyond that range.
A closer examination of the protest dataset provides additional context for how these premiums behave in practice. Among confirmed cases, most awarded premiums fall between roughly 5% and 15%, with a mean of 12.4% and a median just under 10%.
At first glance, this clustering appears to support the conventional 10% rule. Many practitioners observe that a large share of premiums fall near this range and infer that outcomes depend on remaining within it. That interpretation, however, does not follow from the data itself. The protest dataset does show clustering, but it also shows substantial variability within that cluster. Outcomes within the same range do not resolve consistently.
Part of this pattern reflects the nature of the dataset. Protest decisions disproportionately capture close-call competitions in which a tradeoff decision is required and challenged. As a result, they naturally concentrate in the range where price and non-price differences are both material and subject to interpretation. The clustering, therefore, indicates where decisions tend to be contested, not where they are determined.
More importantly, the data shows that similar price premiums can lead to different outcomes. A premium within this range may be accepted in one case and rejected in another, depending on how evaluators assess the strength of the underlying technical advantage and its relevance to the requirement. This is the key empirical insight. The premium percentage alone does not drive the decision. The same premium has different results depending on the perceived value it represents.
Taken together, these observations clarify the role of price differentials in best-value decisions. The clustering creates the appearance of a rule, but the outcomes do not follow one. What matters is not where a proposal falls within a range, but whether the evaluators can justify the premium based on the specific advantages it offers.
This variability extends beyond the clustered range. The dataset shows that similar price premiums produce different outcomes not only within the 5 to 15% band, but across the full range of observed values. A premium near 14% can be accepted in one case and rejected in another. A premium exceeding 40% can be justified when supported by strong, multi-factor advantages, while a smaller premium can fail when the underlying benefit appears marginal.
The implication is straightforward. The distribution of premiums shows where decisions tend to occur, but it does not determine how those decisions are made. Treating the average or the clustered range as a rule mischaracterizes the critical non-price part of a best value evaluation as done in practice. Best-value outcomes reflect evaluative judgment about the relative strength of competing proposals, not adherence to a pricing threshold.
Implications
To understand those factors, we examine how evaluators actually make source selection decisions. Source selection authorities do not justify outcomes by citing price differences alone. They explain decisions by describing the differences between proposals and why those differences matter. The evaluation record focuses on specific strengths, weaknesses, and risks and how they affect expected performance. [3]
Viewed through this lens, the data becomes easier to interpret. A premium is accepted when the advantage appears clear, meaningful, and relevant to the requirement–where the perceived value of the advantage exceeds the incremental price according to the evaluation criteria. A premium is rejected when the value of the advantage appears marginal, uncertain, or disconnected from mission outcomes and is low relative to the incremental price. The outcome does not track the size of the price gap. It tracks how evaluators interpret the difference in value between proposals.
This leads to the central conclusion of the analysis. It is not the size of the price premium that drives best-value decisions. It is the size and credibility of the non-price advantage, and whether that advantage provides a sufficient basis for evaluators to justify paying more.
This conclusion also explains why the dominant outcome occurs so frequently. When one proposal offers a clear advantage at a lower price, the decision becomes straightforward. No tradeoff is required because the evaluation does not involve balancing competing factors. The proposal simply offers more value in both dimensions.
For industry, this reframing carries practical consequences. The most straightforward path to contract award in a best-value environment is not to manage a tradeoff within a target price range. It is to design an offer that can win on both technical merit and price. While that position is not always achievable or desirable (because the bidder does not capture the full value of its superior offering), it represents the strongest possible outcome for the customer and the most common one observed in the data. [4]
Achieving that position requires more than incremental optimization. It requires a clear understanding of what the customer values most (beyond the language of the solicitation) and a viewpoint on competitors’ likely bids. Teams must assess how different solution elements contribute to the customer’s objectives and where incremental improvements create meaningful value versus where they do not. This understanding allows teams to make deliberate tradeoffs within their own solution, balancing capability and cost to maximize value for the customer, and therefore the highest total evaluated score.
When a dominant position cannot be achieved without introducing unacceptable execution risk, the path to winning shifts. In those cases, one path to success is to establish a level of differentiation that evaluators can clearly recognize and defend. That differentiation must go beyond surface-level improvements or proposal presentation. It must connect directly to mission outcomes, reduce meaningful risk, or improve performance in ways that matter to the customer. The value from this differentiation must exceed the price premium relative to the next-best bidder. The other path is to ensure the price advantage exceeds any incremental value from a competitor’s higher-rated offering.
When higher rated bids lose, it often reveal a gap between how the bidder perceives its own value and how customers evaluate it. When the perceived advantage does not justify the additional cost, the government will select the lower-priced option.
The Winning Approach
Navigating this best value dynamic requires a more disciplined and thorough approach to competitive assessment. Teams must look beyond ratings and examine whether their differentiators address the aspects of performance the customer values most. They must also assess whether those differentiators are strong enough to support a price premium in the evaluator’s judgment. This is where a traditional “price to win” analysis falls short. The exercise should not simply be about identifying a price point. It is about assessing total evaluated score and understanding how both price and non-price factors combine to determine relative position. We conduct a rigorous analysis to generate insights into competitors’ likely offerings and corresponding non-price scores, then combine those insights with expected pricing to determine the offer that will win on total score.
This approach helps teams avoid a different risk that often goes unaddressed. Many teams focus on avoiding a price premium and respond by compressing price to remain within a perceived safe range. That can lead to underpricing relative to the value offered. When a proposal establishes a clear and credible advantage, the government demonstrates a willingness to pay for that value. Failing to reflect that advantage in pricing can leave money on the table and create conditions that make program execution more difficult.
The total evaluated score approach also helps teams avoid treating pricing as an isolated decision. The price must reflect both the value being offered and the strength of the competitive position. Teams that align solution design, proposal development, and pricing around a clear understanding of relative advantage gain flexibility in how they compete. Those that anchor on a price discount or premium band are reacting to a signal that does not determine the outcome.
This is where a more strategic approach to capture and pricing becomes necessary. Rather than treating price as a standalone variable, effective teams assess position to win from the customer’s perspective, integrating non-price differentiation and pricing into a single view of total evaluated score. That requires us to understand how evaluators interpret competing proposals, how technical differences translate into mission-relevant value, and how to defend those differences in a tradeoff decision.
At SMA, this perspective is central to how we support clients in complex procurements. We combine detailed cost and price analysis with deep technical and domain expertise to evaluate competing solutions and determine how the customer will assess their value. By aligning solution design, value proposition, and pricing strategy, we help teams move beyond targeting a percentage. Instead, they’ll make deliberate decisions about how to compete, where to differentiate, and how to translate that differentiation into a defensible winning position.
Organizations that adopt this mindset move beyond rules of thumb and instead design offers that maximize their likelihood of selection based on best overall value.
Competing for Best Value
The persistence of the 10% rule is understandable. Many decisions do occur within a relatively narrow price range, and smaller gaps are easier for evaluators to justify. However, that observation does not make the rule predictive. It describes part of the environment but does not explain the mechanism that determines outcomes.
While the available data does not represent the full population of best-value procurements, it is sufficient to test the central premise of the 10% rule. Across both datasets, similar price differentials lead to different outcomes. That consistency is enough to demonstrate that no fixed pricing threshold governs best-value decisions.
A more useful viewpoint recognizes that best-value competitions are resolved in three ways. Many resolve through clear superiority, where one proposal dominates on both technical merit and price. But the balance is resolved through tradeoff decisions, where evaluators must weigh differences and determine the relative value of the superior offering or the lower price. That is, does the higher-rated offering justify paying the price premium?
Within that structure, price influences how difficult a decision is, but it does not determine how it resolves. The outcome ultimately depends on whether one proposal establishes a meaningful and credible value advantage over another.
Best-value decisions do not follow a threshold. They follow a value comparison based on evaluation criteria that vary across solicitations. That has direct implications for how companies compete. The objective is not to remain within a target price percentage. The objective is to establish a true best value position that justifies the award.
 |
Ajay Patel, CF APMP, is SMA’s President and Chief Executive Officer, and has over 30 years of consulting, business development, operations, program management, and systems engineering experience. |
 |
Alan Berman is Vice President for Research and Strategic Initiatives at SMA: The Program Lifecycle Company, where he leads the firm’s research agenda and supports strategy, capture, and growth initiatives across the federal market. |
Click here to learn more about our Competitive Assessment and Price-to-Win solutions.
[1] US Government Accountability Office, Best Value Tradeoff Source Selection Process, GAO-09-579 (Washington, DC: Government Accountability Office, July 2009).
[2] SMA analysis of GAO protest decisions (2012–2026). We constructed the dataset through a systematic review of GAO bid protest decisions. The analysis focused on cases involving best-value tradeoff source selections. Only decisions with sufficient detail on evaluation results and pricing were included. This review yielded 38 relevant decisions. Of these, 11 involved the government selecting a higher-rated, higher-priced proposal. In those cases, the available data allowed us to quantify the associated price premium. Extracted data included evaluated price differences, relative technical ratings, and documented source selection rationale. The dataset is not representative of the full population of procurements. Protest decisions reflect a selectively revealed sample. Parties are more likely to challenge tradeoff decisions, especially those with higher-priced winners. They also tend to include detailed evaluation records in those cases. For this reason, the analysis uses the dataset to assess the magnitude and variability of observed price premiums. It also examines the factors that influence tradeoff decisions. It does not attempt to estimate how frequently those outcomes occur. The dataset is not comprehensive. However, it is directionally robust for evaluating the relationship between price differentials and award outcomes. The observed overlap between accepted and rejected premiums shows that outcomes do not follow a consistent pricing threshold.
[3] Department of Defense guidance describes best-value source selection as a comparative evaluation. In this process, the Source Selection Authority exercises independent judgment to determine which proposal provides the greatest overall benefit. Agencies vary the relative importance of price and non-price factors across the best value continuum. They must also state how they weight those factors in the solicitation. In tradeoff acquisitions, the decision does not rely on a formula or fixed threshold. Instead, the Source Selection Authority compares proposals based on the stated evaluation factors. The Authority must also document the rationale for the decision. This includes explaining why any additional cost is justified by the perceived benefits. The guidance allows agencies to select a higher-rated, higher-priced proposal. It also allows them to choose a lower-priced proposal when the advantage does not justify the premium. In other cases, agencies may select a proposal that is both higher-rated and lower-priced. Defense Acquisition University, Best Value Continuum, ACQuipedia article (Fort Belvoir, VA: Defense Acquisition University, n.d.); Defense Acquisition University, The Best Value Continuum and Source Selection, presentation slides, September 24, 2024.
[4] In practice, achieving a position that combines the highest evaluated technical merit with the lowest evaluated price is not always the result of a fundamentally superior solution. While some firms do introduce novel approaches that improve performance while reducing cost, such cases are relatively uncommon. More often, this position reflects one of several underlying strategies. In some cases, firms pursue significant cost reductions by changing their delivery model, even when they have not fully proven those changes at the time of proposal submission. For other cases, firms develop a credible approach to cost reduction and incorporate those efficiencies directly into their proposal. In other cases, firms intentionally discount their prices to secure the award. This is especially common in fixed-price environments, where competition establishes price reasonableness. These decisions may reflect broader business considerations, including anticipated follow-on work, sustainment opportunities, or strategic positioning. Each approach carries a different level of execution risk. Evaluators may factor that risk into their assessment of the proposal’s overall value.
Posted on April 24, 2026, by
Dick Eassom, CF APMP Fellow, SMA, Inc.


