

6 minute read
July 15, 2020
The problem with most estimates today is that they are single point numbers with no context as to how optimistic or pessimistic they are. Then they normally have one or more safety factors applied without any real overarching goal other than not going “over budget,” and no real basis for the factors applied.
By Douglas D. Plummer, PMP
Everyone who has ever prepared a quote or Basis of Estimate (BOE) for a proposal has probably found themselves in the position of padding an estimate received from their team to prevent an overrun position down the road during execution. Let’s take a closer look at how we can get a better handle on the validity of the original quote, and how much of a safety factor we should add based on our overall program objectives and program constraints such as the Price-to-Win (PTW).
First let’s take a quick look at some of the methods we can use to develop the initial estimate.
Estimating Methodologies
- Analogous: Uses similar projects/efforts as a basis for the estimate. Requires adjustments based on comparative complexity, known differences, inflation, rates, etc.
- Parametric: Applies a formula to the driving parameter; 30 drawings times 24 hours per drawing. Requires historical data and good knowledge of quantities involved.
- Expert Opinion (Delphi): Based on the opinions of experts for the task or project at hand. More accurate as more experts are consulted. Use when other methods not available.
- Bottom Up: Requires a detailed Work Breakdown Schedule (WBS), an accurate and realistic design concept, vendor cost, and resource productivity rates.
Most proposal efforts use some combination of Bottom Up and Parametric. Analogous and Expert Opinion are better suited to rough orders of magnitude (ROMs) and running sanity checks, etc., unless the new task or program is very similar to a previous one.
Getting to a Known Baseline
When we ask someone to give us a quote to do a task, we really don’t know much about the assumptions that went into their number. Did they just give us their best guesstimate of what it would take? Are they an optimistic or pessimistic person? Have they added a safety factor to prevent an overrun situation? What is the true basis of the number? One way around this guessing game is to use three-point estimates.
Three-Point Estimation
Uses Best Case, Most Likely, and Worst Case estimates to find the mean or baseline number and to develop an overall range for the data. From this range, we can calculate the level of uncertainty or standard deviation. The standard deviation, or sigma, can then be used to gauge risk and develop confidence levels for the overall estimate. The initial result though is mean time or dollars to complete the task. Here are the details required to develop the mean:
- Best Case: How long would it take to complete the task under perfect conditions? What could go right? What do we need to do to make this happen?
- Most Likely: How long will it take to complete the task under standard conditions?
- Worst Case: How long will it take to complete this task if things go poorly? What could go wrong? What are the risks, and what can we do to avoid them?
- Weighted Average or Mean = (Best Case + 4 × Most Likely + Worst Case) / 6
Using this method also gives us insight into how we can improve our timing (opportunities) and what the risks are that could throw us off course. These risk and opportunity factors are identified early during the Best Case and Worst Case analysis when the process is applied correctly.
Now that we have a known point, in this case the mean time to complete the task, we can also look at the range of deviation from the mean that one can expect based on standard deviation, sigma (σ). By applying one or more standard deviations to our baseline, we can predict with a fairly high degree of confidence, our probability of actually completing the task within the time or cost allotted.
Let’s look at a typical bell curve showing the range of possible outcomes over many iterations of a task or project.
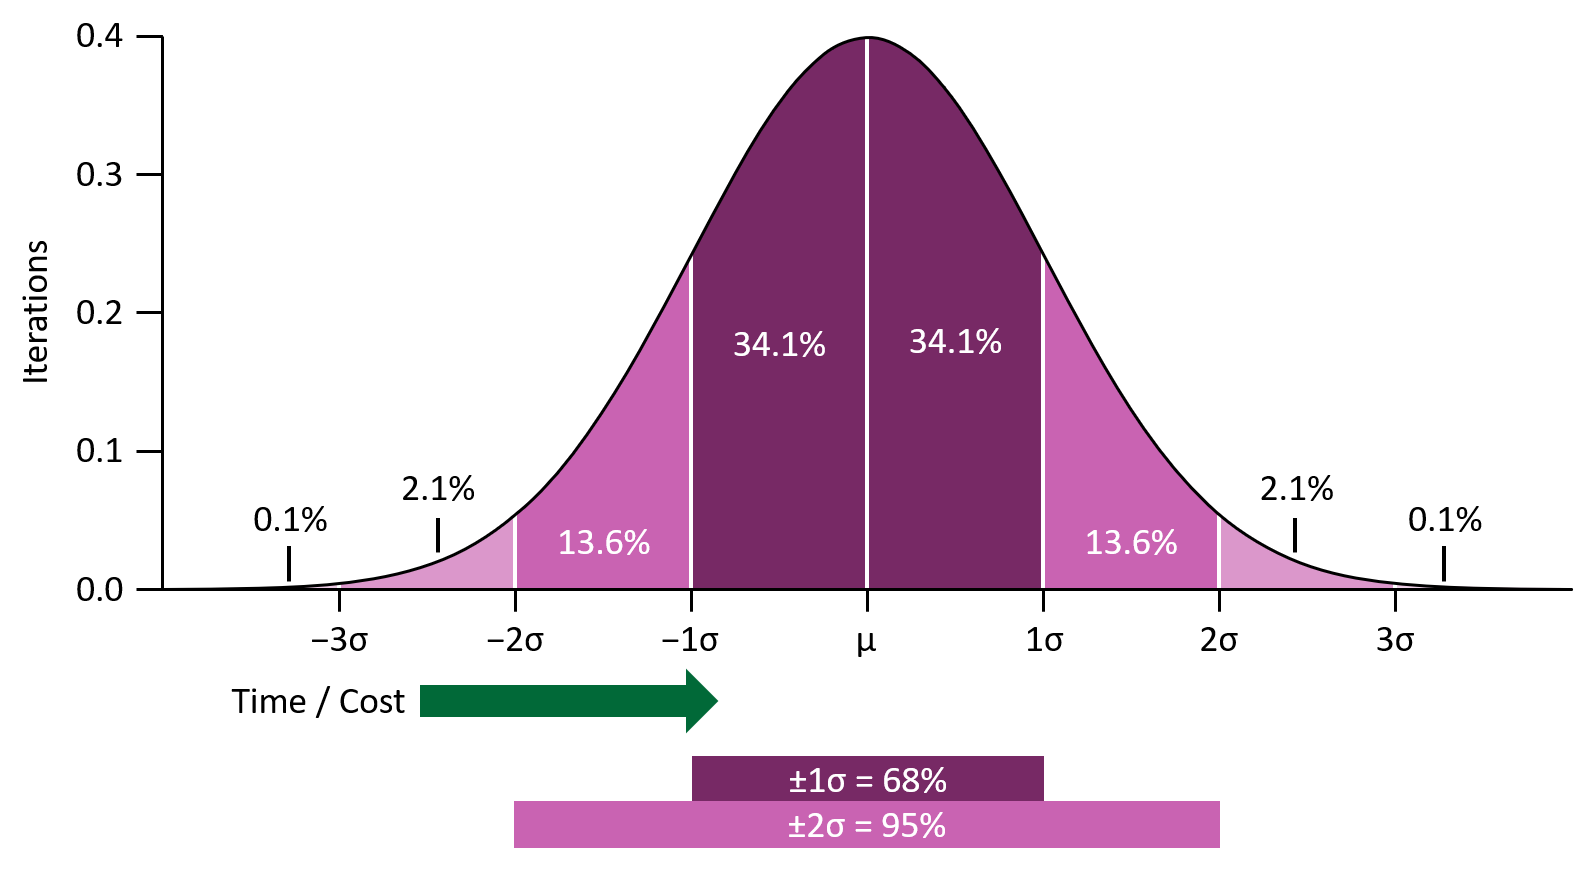
Three-point estimates get you to the mean point where 50% of the iterations take more, and 50% take less time than predicted: ±1σ covers 68% of predicted outcomes and ±2σ covers 95% of predicted outcomes.
Takeaways from Standard Distribution (Bell Curve)
- A single point estimate is indeterminate—it depends on person doing estimating
- The three-point estimating technique gets you to the mean (50/50 outcome)
- Standard deviation, σ, allows us to factor in what could go right or wrong. σ = ~(Best Case − Worst Case) / 6
- ±1σ captures about 68% of all possible outcomes
- ±2σ captures about 95% of all possible outcomes
Applying the New Knowledge
Now that we understand the mean point and the amount of safety factor to apply to get to either 68 or 95% probability, we can start to make rational decisions about our quotation based on other factors such as the Price-to-Win, and desired profit margin, etc. Senior management can now be presented with options, and can make informed decisions, as to how much risk they are willing to take with real data to work with rather than having to start with a number that “we think should be safe,” but can’t actually back up with any true rationale.
Summary
Estimates from teams and managers with random safety factors applied are indeterminate as far as their relationship to the expected outcome of any program or project. This is especially true when multiple layers of factors are applied. By using three-point estimates to find the mean, and then calculating the standard deviation, σ, we can provide a range of pricing options with a known probability of success. This process also starts to highlight some of the objectives we need to work towards (opportunities), and some of the risks that we need to avoid right up front if we want to be successful. This approach gives the team the confidence they need to negotiate with upper management during quote preparation, and with the customer down the road when they come back and ask for a Best and Final Offer (BAFO).
Caveat and Closing Thoughts
This process is best when applied to Work Breakdown Structures with multiple lines delineated. It should not be used for a single data point as it won’t be statistically significant. Also, this is not a substitute for poor program and project management. This is a process that lets good, well managed teams develop achievable, repeatable performance metrics. Remember, as a Program Manager, you can’t predict the future, but you can plan the future and shape outcomes.
 |
Doug Plummer, PMP, is an SMA Principal Associate with over 35 years of experience as a Program and Proposal Management professional. |
If you’re building a team and you have positions you can’t fill, you need to use SMA Talent on Demand (TOD®)! With TOD®, you can find experienced talent, such as Doug, matched to your exact needs:
Posted on July 15, 2020, by
Dick Eassom, CF APMP Fellow, SMA, Inc.


